STAT1008 Lecture Notes - Lecture 22: Standard Score, Standard Deviation, Percentile


STAT1008 Week 8 Lecture A
● How do we find areas under a normal density?
○ Know the mean and standard deviation of the normal distribution
○ Can use calculus (finding area under the curve)
○ E.g. Verbal SAT scores
■ Suppose that verbal SAT scores for applicants at a college follow a
normal distribution with mean mu = 580 and stn. Dev = 70
■ What proportion of applicants have SAT score above 700?
■ R: pnorm (700, mean=580, sd=70, lower.tail=FALSE) = 0.043
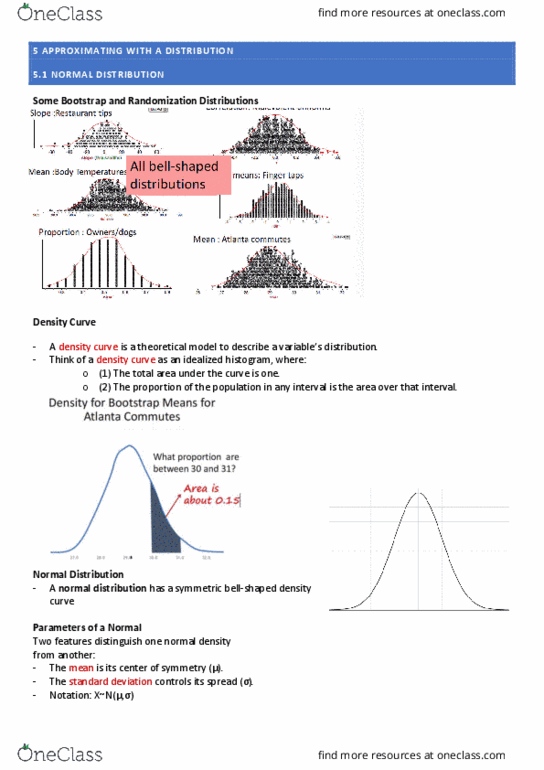
○ E.g. Bootstrap means
■ Suppose that the bootstrap distribution of means for samples size 500
Atlanta commute times is N(29.11, 0.93)
■ Find an endpoint (percentile) so that just 5% of the bootstrap means are
smaller thus from R: qnorm(0.05, mean=29.11, sd=0.93) = 27.58029
● Finding probabilities for N(mu, std dev):
○ About what proportion should be within one std dev of the mean?
○ Note: All that really matters is the number of standard deviations from the mean
● Standard Normal:
○ Mean = 0, Standard deviation = 1 thus Z~N(0,1)
○ To convert any X~N(mu,standard deviation) to Z~N(X-mu, standard deviation) <-
Z score
○ Z score = standard normal
○ Standardise the endpoints, then use Z~N(0,1)
○ E.g. Dog/Owner randomisation proportions, p hat approx N(0.5,0.1)
■ X-area above 0.64 = Z-area above 0.64-0.5/0.1 = 1.40
■ 1.40 represents the area on the LHS of 0.64
● Converting Normals:
○ X~N(mean, standard dev) -> Z= X-mu/standard dev -> Z~N(0,1) -> X = hu + Z x
Std Dev -> X~N(mean, standard dev)
○ E.g. Percentile for verbal SAT
■ 25% percentile (Q1) for Z~N(0,1) is -0.674
■ Find the 25% percentile for the Verbal SAT~N(580,70) distribution
● X = mu + Z x stn dev = 580 + (-0.674)(70) = 533
● Standardings:
○ If X~N(mu, stn dev) then use the linear transformation Z= X-mu/stn dev ~ N(0,1)
○ The resulting standardised value is sometimes called the “z value” or “z score”
○ For Z~N(0,1), values for Pr(Z< or equal to z) are available in tables
○ So, for ANY random variable that comes from a normal distribution, if we subtract
the mean and divide by the stn dev, we get a r.v.~N(0,1)
○ Area in tables - Pr(Z<z) = area to the left of z
find more resources at oneclass.com
find more resources at oneclass.com
Document Summary
Know the mean and standard deviation of the normal distribution. Can use calculus (finding area under the curve) Suppose that verbal sat scores for applicants at a college follow a normal distribution with mean mu = 580 and stn. R: pnorm (700, mean=580, sd=70, lower. tail=false) = 0. 043. Suppose that the bootstrap distribution of means for samples size 500. Find an endpoint (percentile) so that just 5% of the bootstrap means are smaller thus from r: qnorm(0. 05, mean=29. 11, sd=0. 93) = 27. 58029. Note: all that really matters is the number of standard deviations from the mean. Mean = 0, standard deviation = 1 thus z~n(0,1) To convert any x~n(mu,standard deviation) to z~n(x-mu, standard deviation) z= x-mu/standard dev -> z~n(0,1) -> x = hu + z x. 25% percentile (q1) for z~n(0,1) is -0. 674.