MIS171 Lecture Notes - Lecture 4: Box Plot, Categorical Variable, Level Of Measurement

6 Sep 2018
School
Department
Course
Professor
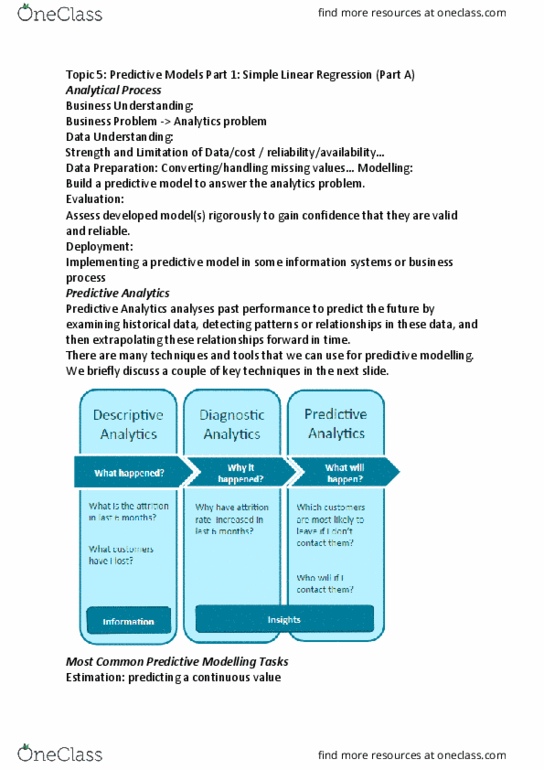
Document Summary
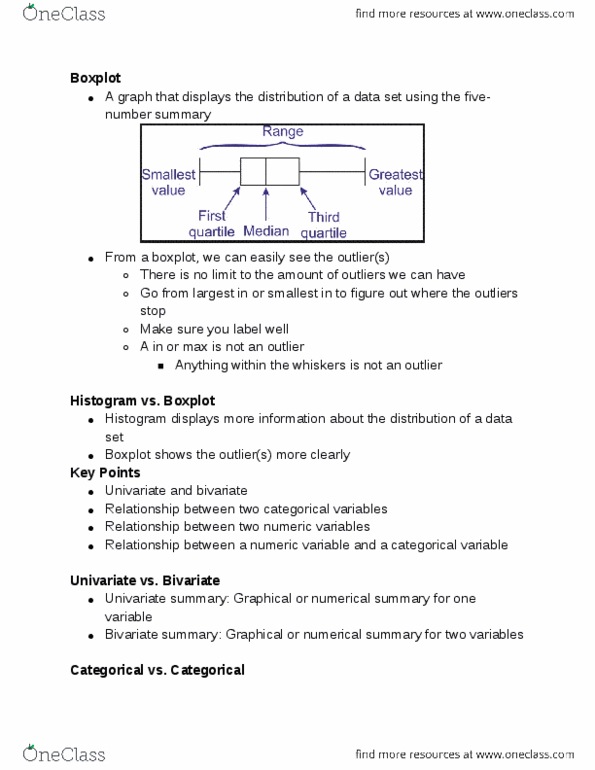
After last week, we can now summarise a single variable (univariate. In particular, we can describe the variation in the dependent variable. In other words, we are now interested in looking for a relationship between two variables (bivariate analysis). Decide which variable is the dependent variable and which is the independent (or explanatory) variable. Numerical data can be converted to categorical data cross-tab. The dependent variable is numerical and the independent variable is categorical so comparative summary measures & multiple box plot are suitable. When comparing summary measures, we look for differences between the subgroups across the key features of central tendency, variation, shape and location. same spend amounts? the attendee"s can explain us see whether explain variation in spend? location the. If there are substantial differences then we say that there appears to be a relationship. If there is no or only a small difference then we say that there does not appear to be a relationship.