BIOL1020 Lecture 15: BIOL Prac 7- What is the Chi square test


This preview shows half of the first page of the document.
Unlock all 1 pages and 3 million more documents.
Get access


Related Documents
Related Questions
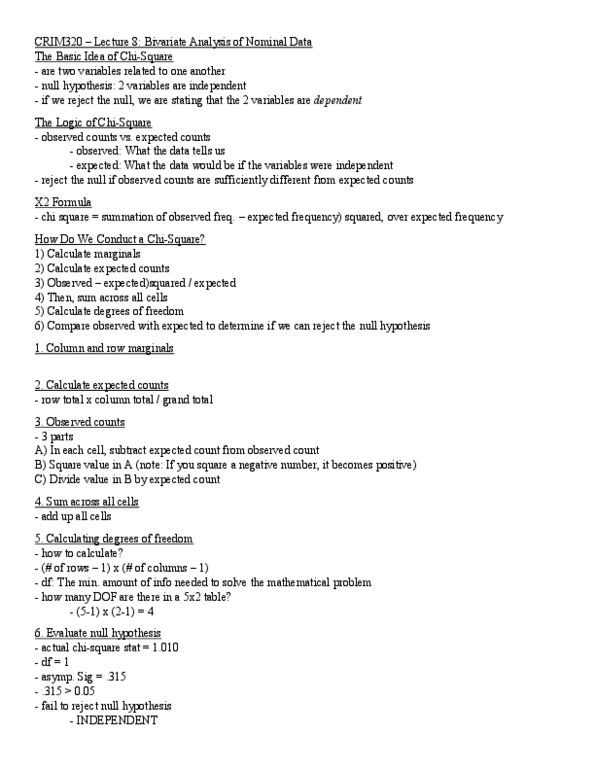
Introduction: A Chi-square test is used to compare observed data with expected data according to a hypothesis. For instance, if you were crossbreeding 2 heterozygous pea plants, you would expect to see a 3:1 phenotypic ratio in the offspring. In this case, if you were to breed 400 pea plants, you would expect to see 300 plants showing the dominant trait and 100 showing the recessive trait. But what happens if you observe only 260 plants with the dominant trait and 140 plants with the recessive trait? Does this mean something is wrong with Mendelian genetics or is this difference in expected results just due to chance (random sampling error)? These are the questions that can be answered using Chi-square statistics. The results of this statistical test is used to either reject or accept (fail to reject) the null hypothesis. The null hypothesis states there is no significant difference between the observed results and the expected results. This means that if the null hypothesis is accepted, the difference in observed and expected results was just a matter of chance and so the observed results basically "fit" with what was expected. Degrees of freedom (df) = number of independent outcomes (Y) being compared less 1 df = Y-1 At the 95% confidence interval we are 95% confident that there is a significant difference between the observed and expected results, therefore rejecting the null hypothesis. Probability Value - Is the decimal value determined from the X2 table and is the probability of accepting the null hypothesis. A 0.05 probability value equates to a 95% confidence interval.
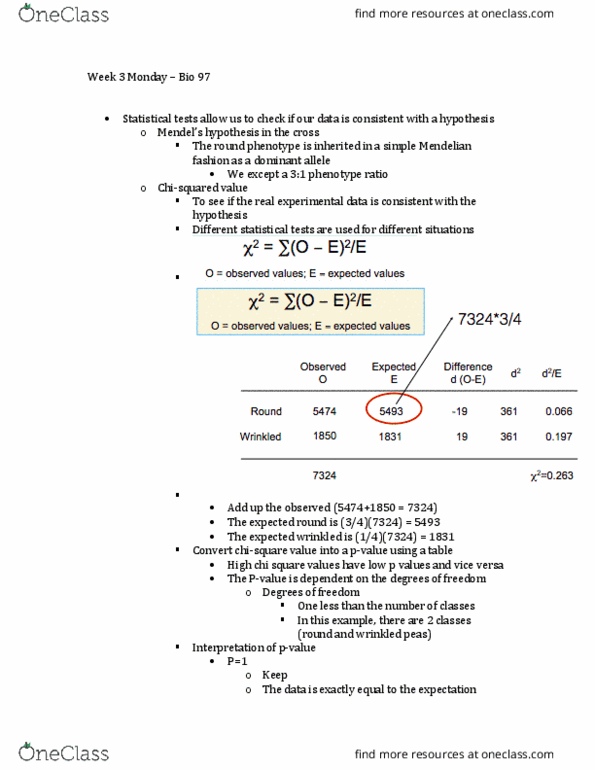
The Chi-squared test formula is: Example: If we cross two pea plants that are heterozygous yellow pods, we would expect a 3:1 phenotypic ratio. So let's say we actually did the cross and got 280 plants with green pods and 120 plants with yellow pods. Question: Is this a 3:1 phenotypic ratio? This is the value of Chi-squared Test. We have a total of 400 plants and we expect a 300 green:100 yellow phenotypic ratio If the calculated Chi-squared value is less than the critical value listed in the Chi-squared table, then we accept the null hypothesis. This means that there is no significant difference between the observed and the expected values. Our degrees of freedom (df) = 2 outcomes - 1, or df = 1. Now we go the X2 table below and using the df = 1 and probability value of 0.05, our critical value is 3.84. Since our calculated X2 value is 5.33, and is larger than the critical value, we reject the null hypothesis and can say (at 95% confidence) that there is a significant difference between our observed and expected values.
The parent generation is yellowed podded and green podded pea plants. You cross a yellow podded pea plant with a green podded pea plant and you get 100% yellow podded plants in the F1 Generation (Phenotypic ratio 4 : 0, yellow to green). What will be the expected phenotypic ratio when you allow the F1 generation to reproduce?
Fill out the Punnett square.
If we actually did the cross and got 1150 yellow and 350 green. Would this be a consistent with what was expected?
Learning Outcomes Questions
1. Why would you run a Chi-squared test?
| To determine if our data is consistent with expected results. | ||
| a To determine if our data is consistent with expected results. b To determine if our data exactly matches the expected results. | ||
| c To determine the expected results. | ||
| d | To compare the phenotypic ratios to the genotypic ratios. |
2. Determine the degrees of Freedom of the phenotypic ratio for this genetic cross.
a. 1
b. 2
c. 3
d. 4
e. 5
3. Using the data given, what is the result of your Chi-squared analysis? x2= ___.
| a. | 2.22 | |
| b | 2.71 | |
| c | 4.36 | |
| d | 187.78 | |
| e | 448.27 |
4. Using the results of your Chi-squared analysis, do we fail to reject or reject the null hypothesis?
| a. | Fail to reject the null | |
| b. | Reject the null | |
| c. | It cannot be determined from the data given |


Choose the corrett answer(s) for questiona 11-16 Please Help
Question 11
A P value represents:
The percentage of the time an experiment gives expectedvalues | ||
The probability that the observed difference between two groupsis due to chance | ||
The degree of biological relevance of the difference observedbetween two groups | ||
One minus the probability that the observed difference betweentwo groups is due to something other than chance (like a treatmentgiven to one group and not the other) |
Question 12
Who makes the final decision whether an article will bepublished?
The peer reviewers , but usually with input from the editor | ||
The funding agency of the study | ||
The CEO of the journal | ||
A third party referee | ||
The editor, but he/she usually considers input from the peerreviewers |
Question 13
Which of the following contain original data produced by theauthors? (Select all correct answers)
Secondary sources | ||
Primary research article | ||
Literature Review | ||
Clinical trials |
Question 13
Which of the following contain original data produced by theauthors? (Select all correct answers)
Secondary sources | ||
Primary research article | ||
Literature Review | ||
Clinical trials |
Question 15
What is a limitation(s) of correlative experiments? (Select allcorrect answers)
Multiple variables may correlate, so it may be difficult todetermine which two are actually related. | ||
It does not account for variability between individuals | ||
They cannot demonstrate causative relationships betweenvariables | ||
Since the population is naturally occurring, dependent variablescannot be assigned |
Question 16
Which of the following is an example of a good hypothesis?(Select all correct answers)
Diabetic patients all carry a mutation in the FOX1P gene | ||
The FOX1P gene regulates sugar homeostasis in adipocytes. | ||
FOX1P has the same sequence in all humans on earth | ||
The FOX1P gene is essential for influenza resistance inmice. | ||
Gene expression is regulated both by environmental, genetic, anddevelopmental factors |
