BUSS1020 Lecture Notes - Lecture 2: Nominal Level, Cumulative Distribution Function, Dependent And Independent Variables

22 Aug 2018
School
Department
Course
Professor
Document Summary
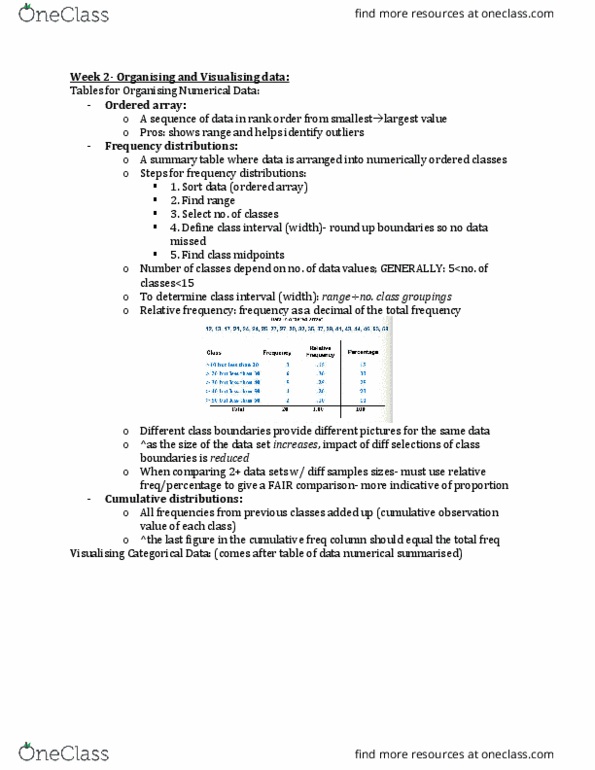
Buss1020 lecture 2 sampling & organising data. Frequency no. of data included in each class (width are all the same not equal to frequency) Relative frequency frequency in the class / sample size (no. of data in total) Percentage frequency convert relative frequency into % If total of relative frequency equals to 1. 0. 2nd class equal to the sum of 1st & 2nd frequency, etc. Very useful to tell how the data is distributed, visualised distribution. Have more ideas of where data is located. Convert raw data into more useful form. Big data is better (increase size of sample data) more accurate view on the population. Relative frequency take ca(cid:396)e of diffe(cid:396)e(cid:374)ces i(cid:374) the sa(cid:373)ple size (do(cid:374)"t use just f(cid:396)e(cid:395)ue(cid:374)cy fo(cid:396) comparison) Histogram (based on relative frequency data) (bar chart) Zero height rethink the no. of classes. Joining midpoints of classes at their respective frequency form a polygon. Start & end with zero frequency (2 extra classes)