ENVX1002 Lecture Notes - Lecture 5: Scatter Plot, Box Plot

24 Jul 2018
School
Department
Course
Professor
Document Summary
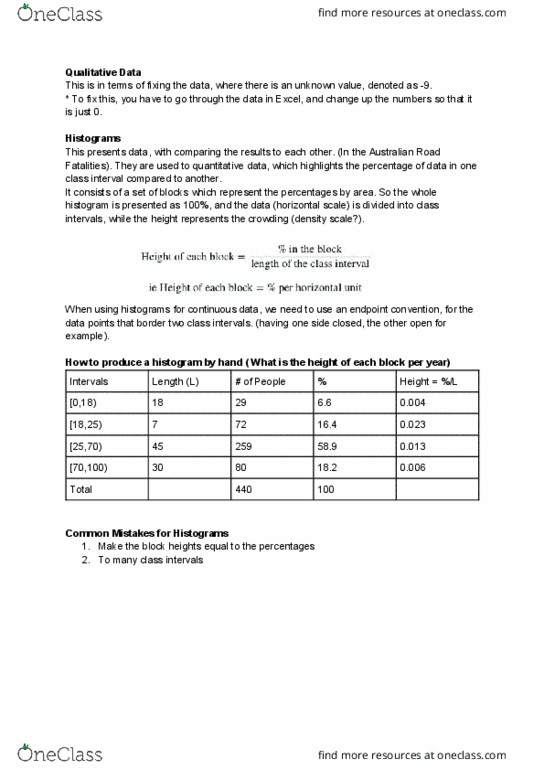
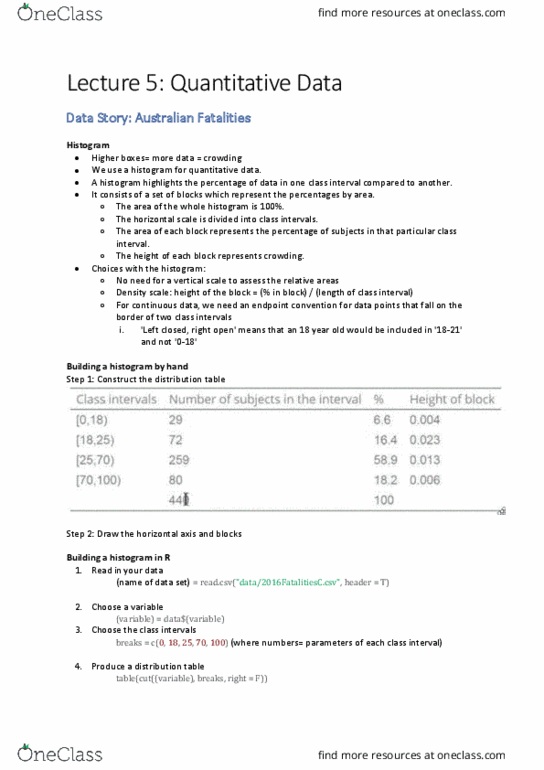
We use a histogram for quantitative data. A histogram highlights the percentage of data in one class interval compared to another. Consists of a set of blocks with represent the percentages by area. The area of the whole histogram is 100% The horizontal scale is divided into class intervals. The area of each block represents the percentage of subjects in that particular class interval. The height of each block represents crowding. Choices with histograms: there is no need for a vertical scale to assess the relative areas, we will mostly use the density scale. The density scale has advantages for later modelling: for continuous data, we need an endpoint convention for data points that fall. Height of each block = % in the block / length of the class interval ei height of each block = % per horizontal unit on the border of 2 class intervals. Mistake 1 : make the block heights equal to the percentages.