PHYL3002 Lecture Notes - Lecture 2: Homoscedasticity, Bonferroni Correction, Repeated Measures Design


LECTURE TWO: Statistics
Summary:
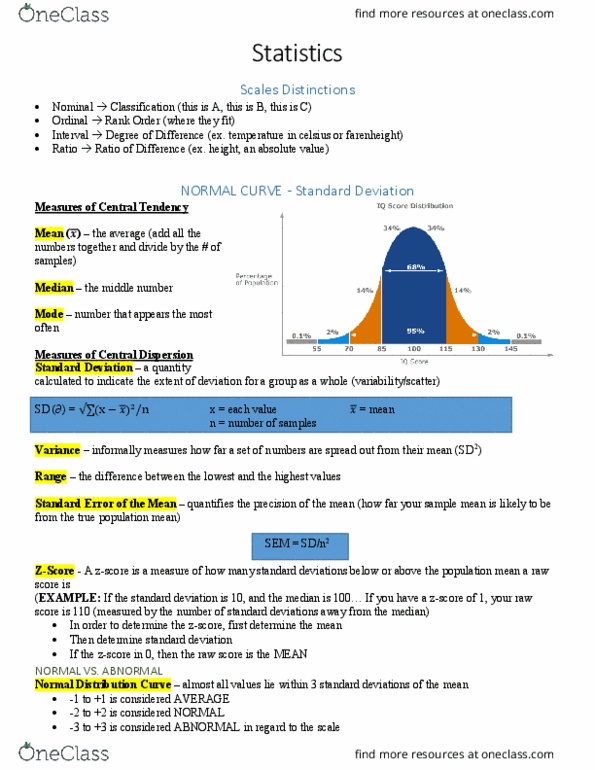
• Mean → measure of central tendency for normally distributed data
o → population mean
o → sample mean
• Standard deviation (SD) → measures variability, measure of dispersion
o s → sample
o → population
• Variance → square of standard deviation
Population vs. Sample:
• Population → divide by n
• Sample → divide by n-1
• SD → average of deviations, difference from mean
• If you have n=1 → no deviations
• If n=2 → only 1 real deviation
• In general → once you know the mean the number of independent
derivations from the mean is n-1
• Degrees of freedom (v) → number of independent deviations from the
mean (n-1)
• Big samples → does not matter
• Mean of the sample → not the same as true population mean
• Sample mean and SD → estimates of true population mean and SD
• Standard deviations of sample means from population mean → standard
error
Standard Error:
• SEM → error measure of a sample mean
• Find standard deviation of the means of many experiments gives standard
error
• Mean of the repeated experiment has a 2/3 chance of being within one
SEM of the last experiments mean
• For normal data SEM =
• Use SEM to show confidence in the estimation of the mean
• Use SD to show variation of individuals around the mean
T-Tests:
• Are robust → small deviations from the assumptions will not matter
• Student’s t-test
o If 2 means are the same
o Assumes
▪ Normal distribution
▪ 2 groups are not correlated or connected → independent
samples
▪ SDs are the same
o Use if SD are not different
find more resources at oneclass.com
find more resources at oneclass.com
Document Summary
Lecture two: statistics: mean measure of central tendency for normally distributed data, standard deviation (sd) measures variability, measure of dispersion. Summary: population mean, (cid:1876) sample mean, population, s sample, variance square of standard deviation. Sample: population divide by n, sample divide by n-1, sd average of deviations, difference from mean. Standard error: sem error measure of a sample mean, find standard deviation of the means of many experiments gives standard error, mean of the repeated experiment has a 2/3 chance of being within one. If groups are different variability between groups will be larger than variability within each group: calculate deviation (sum of squares, ss) for each sample from its, find within group variances 2 and between group variances. If bonferroni finds a difference you can believe it hoc test (cid:523)i. e. tukey"s(cid:524) If increasing x also increases y positive r.