ECON 1B03 Lecture Notes - Lecture 4: Hyperbola
89 views11 pages
4 Jan 2017
School
Department
Course
Professor
Shanghaibalcony1234 and 37744 others unlocked
46
ECON 1B03 Full Course Notes
Verified Note
46 documents
Document Summary
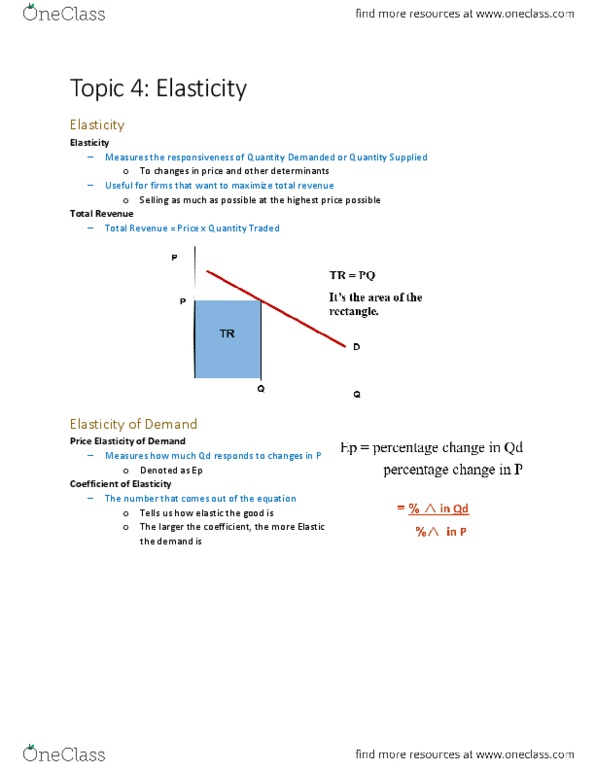
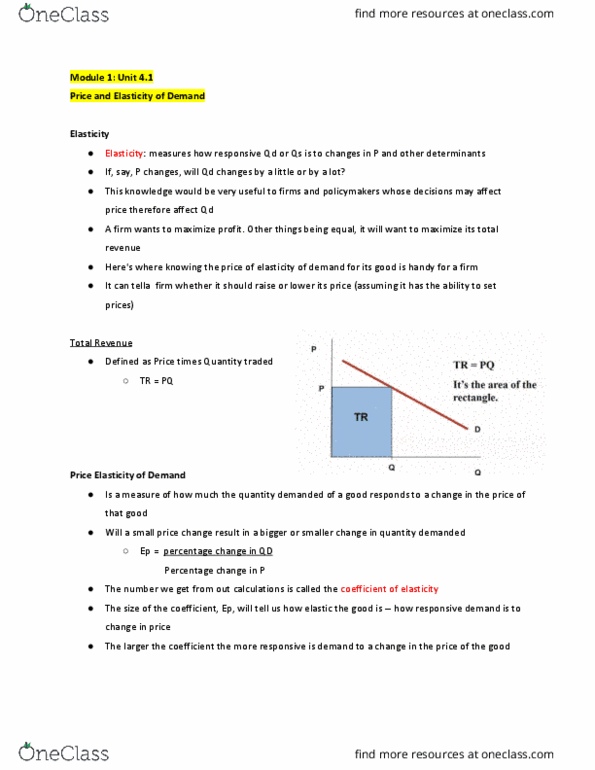
Measures the responsiveness of quantity demanded or quantity supplied: to changes in price and other determinants. Useful for firms that want to maximize total revenue: selling as much as possible at the highest price possible. Measures how much qd responds to changes in p: denoted as ep. The number that comes out of the equation: tells us how elastic the good is, the larger the coefficient, the more elastic the demand is. Total revenue = price x quantity traded. Demand is not very responsive to p changes: % change in p > % change in qd. Ep < 1: results in a steep demand curve, e. g. Demand is not responsive to p changes at all: % change in p = 0 change in qd. Ep = 0: results in a vertical demand curve, e. g. Demand is very responsive to p changes: % change in p < % change in qd. Ep > 1: results in a flat demand curve, e. g.
Get access
Grade+20% off
$8 USD/m$10 USD/m
Billed $96 USD annually
Homework Help
Study Guides
Textbook Solutions
Class Notes
Textbook Notes
Booster Class
40 Verified Answers
Class+
$8 USD/m
Billed $96 USD annually
Homework Help
Study Guides
Textbook Solutions
Class Notes
Textbook Notes
Booster Class
30 Verified Answers
Related Documents
Related Questions
Over the last year your boss has noticed that it would be useful for your firm to understand how consumers behave when variables in the market change and how these changes affect the total revenue for your product. You have been asked to do an analysis for your product, Good A, by addressing the following questions and reporting the results to your boss in a formal paper.
Questions:
- Define the price elasticity of demand? What information does it provide? How is it calculated?
- Define the income elasticity of demand? What information does it provide? How is it calculated?
- Define the cross-price elasticity of demand? What information does it provide? How is it calculated?
- What is total revenue? How is it calculated?
- Define elastic, inelastic, and unitary elasticity means. How are these related to total revenue? Explain your answers.
- With respect to the price elasticity of demand, construct a graph using the data in Figure1. Illustrate the ranges on the demand curve that indicate elastic, inelastic, and unitary elasticity. Explain your answers. Enter non-numerical responses in the same worksheet using textboxes.
- Calculate the total revenue for each level of demand and post into the table, Figure 1. (Copy and paste this table into the Microsoft Word document that will form part of your submission.)
- Using the midpoints formula presented in the textbook, calculate the price elasticity coefficient for each price level, starting with the coefficient for the $4 to $6 level. For each coefficient, indicate each type of elasticity: elastic demand, inelastic demand, or unitary demand. Post your answers into the table, Figure 1.
- Assume that the income of consumers changes by 10%, and as a result the quantity demanded for Good A changes by 8%. What is the income elasticity of demand for Good A? What does this mean for your company?
- Assume that the price of competing Good B decreases by 5% and as a result, the quantity demand for Good A decreases by 8%. What is the cross-price elasticity for your product? What type of goods are Good A and Good B?
Figure 1: The Demand Schedule for Barbeque Dinners
Price | Quantity Demanded | Total Revenue | Elasticity Coefficient | Elastic or Inelastic | |
$4 | 100 | __________ | XXXX | XXXX | |
6 | 80 | __________ | __________ | __________ | |
8 | 60 | __________ | __________ | __________ | |
10 | 40 | __________ | __________ | __________ | |
12 | 20 | __________ | __________ | __________ | |
14 | 1 | __________ | __________ | __________ |