ECON 1B03 Lecture Notes - Taipei Metro


Get access


Related Documents
Related Questions
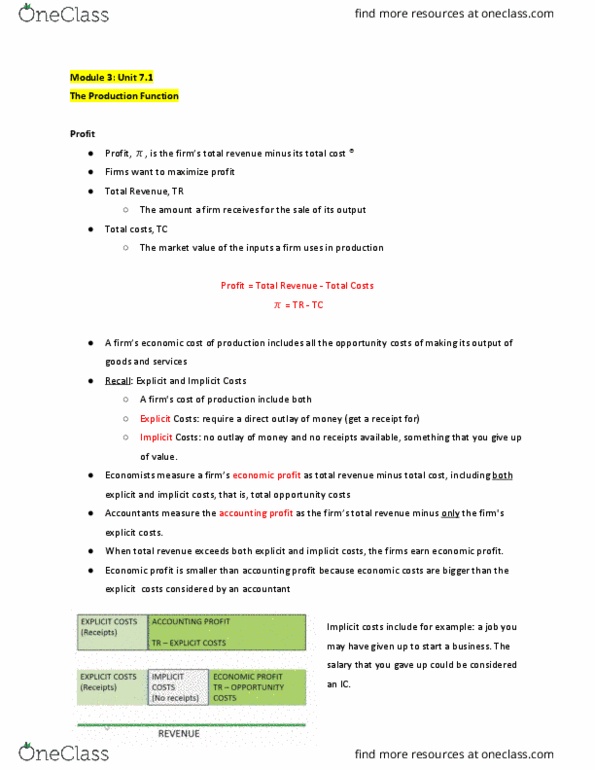
| (1) | (2) | (3) | (4) | (5) | (6) | (7) |
| Output (Q) | Price per Unit (P) | Total Revenue (TR) | Marginal Revenue (MR) | Total Cost (TC) | Average Total Cost (ATC) | Marginal Cost (MC) |
| 0 | $10 | $8 | ||||
| 1 | 9 | 11 | ||||
| 2 | 8 | 12 | ||||
| 3 | 7 | 15 | ||||
| 4 | 6 | 24 | ||||
| 5 | 5 | 35 | ||||
| 6 | 4 | 48 |
Does this data represent the revenues and costs of a perfect competitive firm or a firm with some degree of âmonopoly powerâ? ______________________
How do you know? ________________________________________________
Fill in the blanks in the table above.
How much output should this firm produce to maximize itâs profit? _____units. What price should this firm charge for its product? $_____ per unit.
This choice of output and price will lead to an economic profit = $______
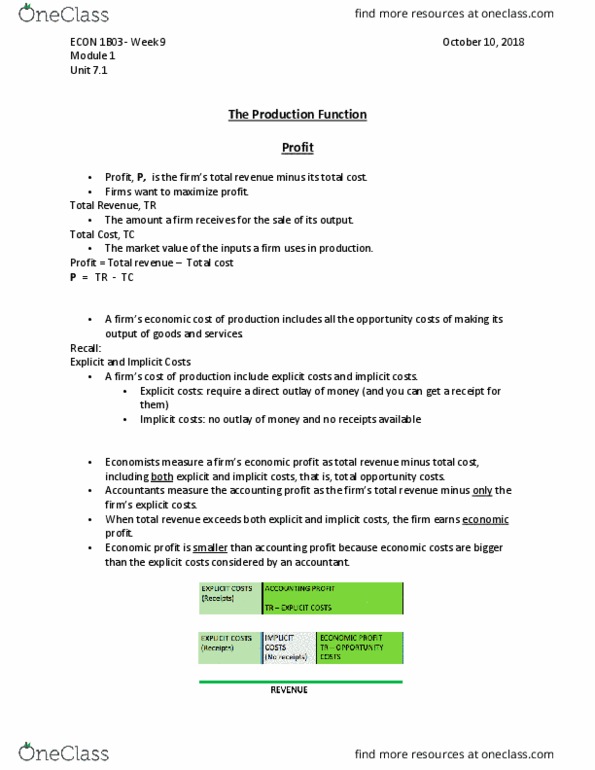
Assume that a firm in a perfectly competitive market can sell its product for $35 (ie price per unit of output). Furthermore, it faces the following costs:
| Output (Q) | Total Cost |
| 0 | 25 |
| 1 | 50 |
| 2 | 100 |
| 3 | 120 |
| 4 | 155 |
| 5 | 190 |
| 6 | 250 |
| 7 | 390 |
a) Calculate Total revenue (TR), Marginal Cost (MC), Fixed Cost (FC), Variable cost (VC), and Average Cost (AC).
b) What is the profit-maximizing output level?
c) Is this firm is making a profit or loss at the profit-maximizing output level? Explain.
d) Do you think the firm will continue its production in the short run?
e) What will be the long-run price in this market?

