PSYCH 1F03 Lecture Notes - Lecture 3: Venn Diagram, Pie Chart, Bar Chart

23 Jan 2019
School
Department
Course
Professor
Document Summary
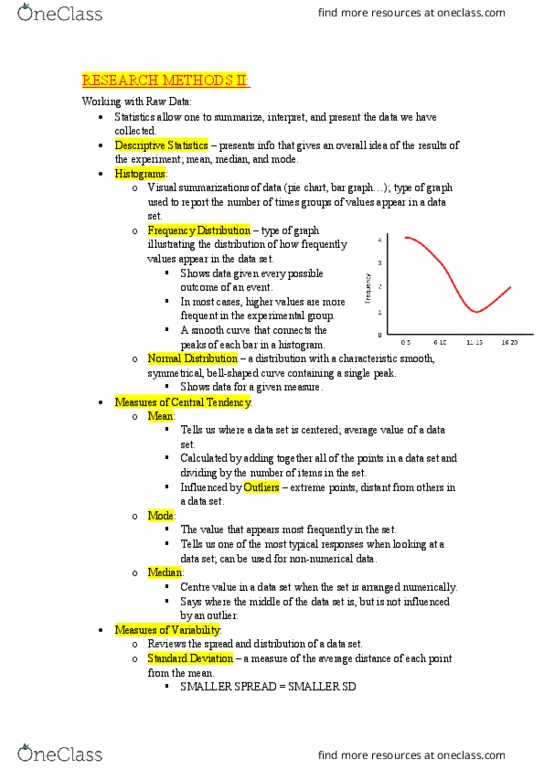
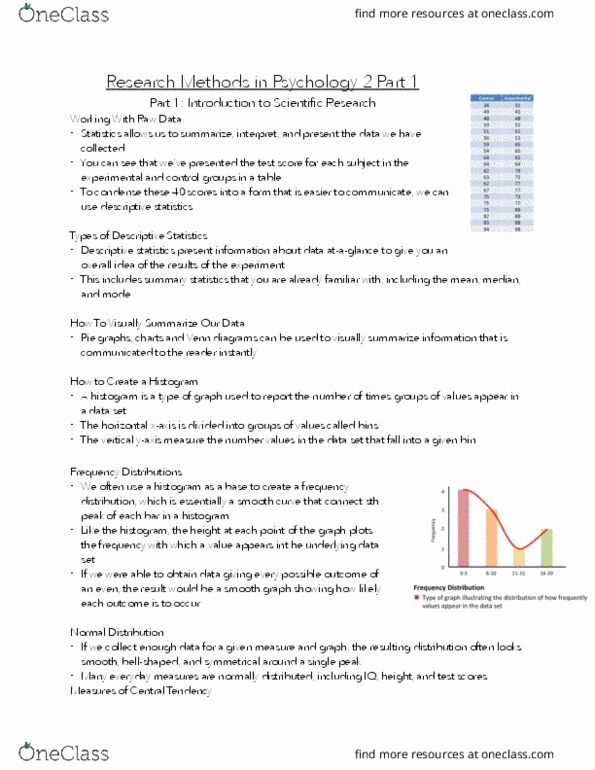
Give the overview of the data at a glance so you can get a general idea of the results of the experiment. Type of graph used to report the number of times groups of values appear in a data set. Type of graph illustrating the distribution of how frequently values appear in the data set. A distribution with a characteristic smooth, symmetrical, bell-shaped curve containing a single peak. Influence of outliers: extreme points, distant from others in a data set. The centre value in a data set when the set is arranged numerically. The value that appears most frequently in the set. Can be used for non numerical data sets. Why measures of central tendencies do not sufficiently summarize data. They really only describe the main result and not the ones around. Descriptive statistics that review the spread and distribution of a data set. Standard deviation: the average spread of data sets from the mean.