QMS 102 Lecture Notes - Lecture 5: Interquartile Range, Statistical Inference, Squared Deviations From The Mean

10 Nov 2016
School
Department
Course
Professor
Document Summary
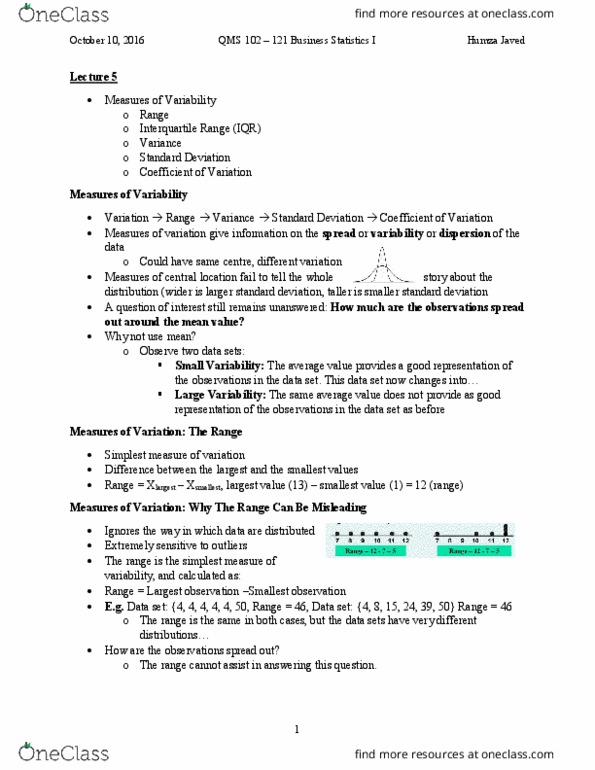
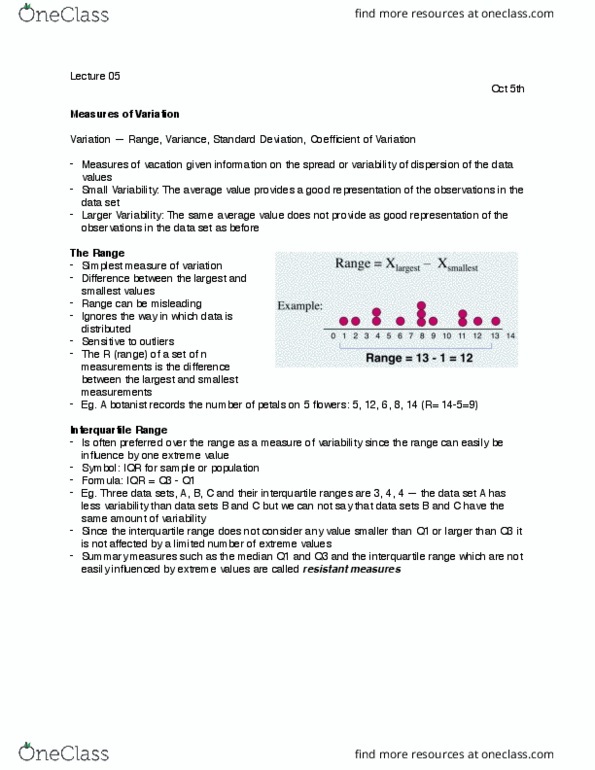
Measures of variation give information on the spread or variability or dispersion of the data values. Measures of central location fail to tell the whole story about the distribution. Range: simplest measure of variation, difference between the largest and the smallest values: Range = x (largest) x (smallest: sensitive to outliers, the interquartile range (iqr) is often preferred over the range as a measure of variability since the range can easily be influenced by one extreme value. Data set a={1, 3, 3, 4, 4, 4, 5, 5, 5, 5, 6, 6, 6, 7, 7, 7, 8, 8, 9, 10} Data set b={1, 3, 3, 4, 4, 4, 5, 5, 5, 5, 6, 6, 6, 7, 7, 7, 8, 8, 9, 20} Interquartile ranges:iqr for a=7-4=3 and iqr for b =7-4=3. From the ranges, it seems that the data set b has more dispersed than the data set a.