STAT 201 Lecture Notes - Lecture 3: Normal Distribution, Frequency Distribution, Intelligence Quotient

29 Sep 2015
School
Department
Course
Professor
Document Summary
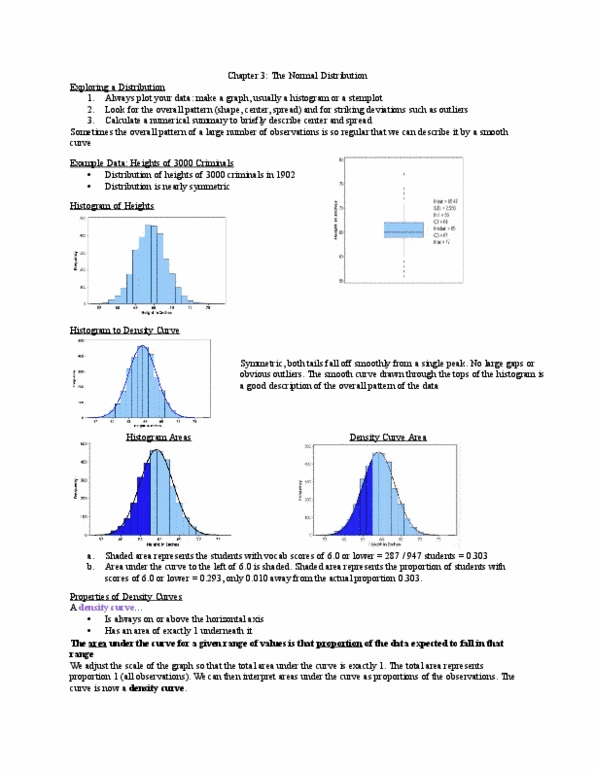
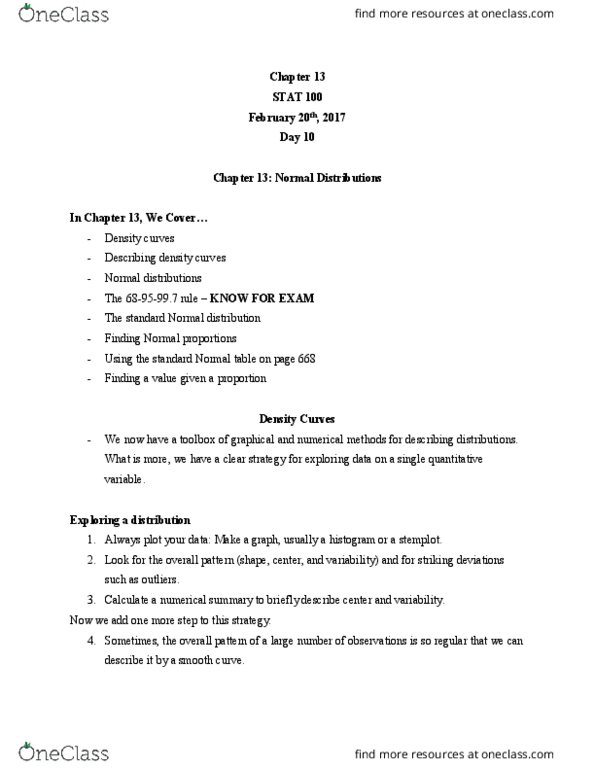
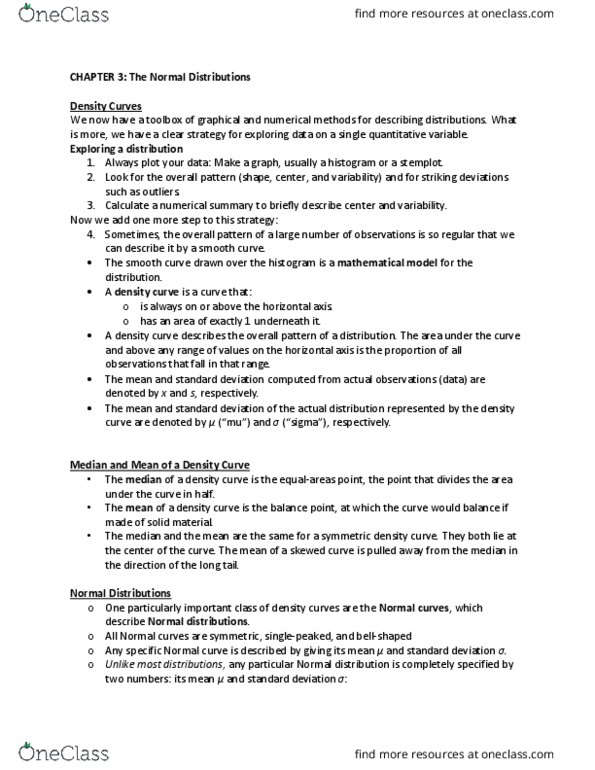
A density curve describes the _________________ of a distribution. The area under the curve and above any range of values is the proportion of all observations that fall in that range. Many real and natural occurrences have frequency distributions that are very close to the normal distribution in shape. Examples: the frequency distribution of the nitrogen content of leaves on a tree tends to be normal. Systolic and diastolic blood pressures, heart rates, blood cholesterol levels, heights of adult men, and weights of ten-year-old girls are all examples of distributions of data that tend to follow the normal distribution. In addition, test scores for many standardized tests, such as the iq test, possess distributions which are bell shaped. The heights of people of the same sex and similar ages follow a normal distribution reasonable closely. Weights, on the other hand, are not normally distributed. The weights of women aged 20 to 29 have mean 155. 9 pounds and median 144. 0 pounds.