PSYC 1010 Lecture 1: Quantification in Psychology - Central Tendecy Part 1.pdf

3 Apr 2015
School
Department
Course
Professor
Document Summary
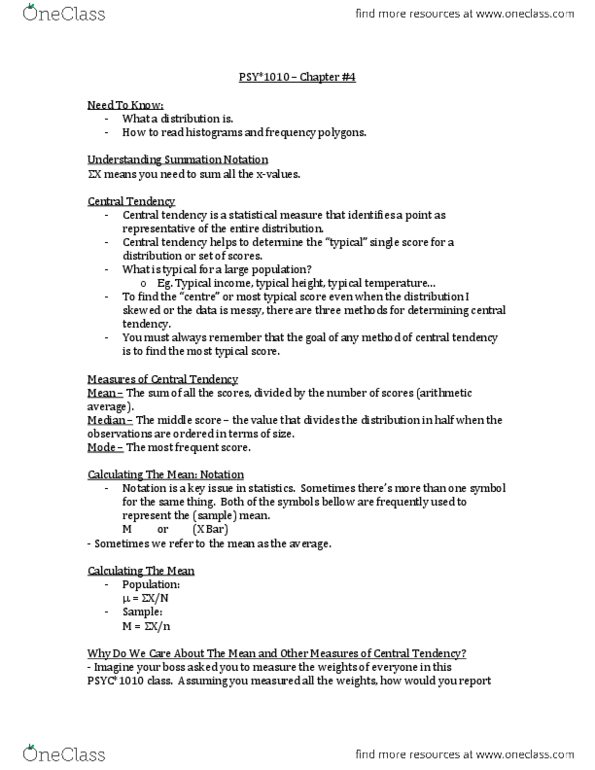
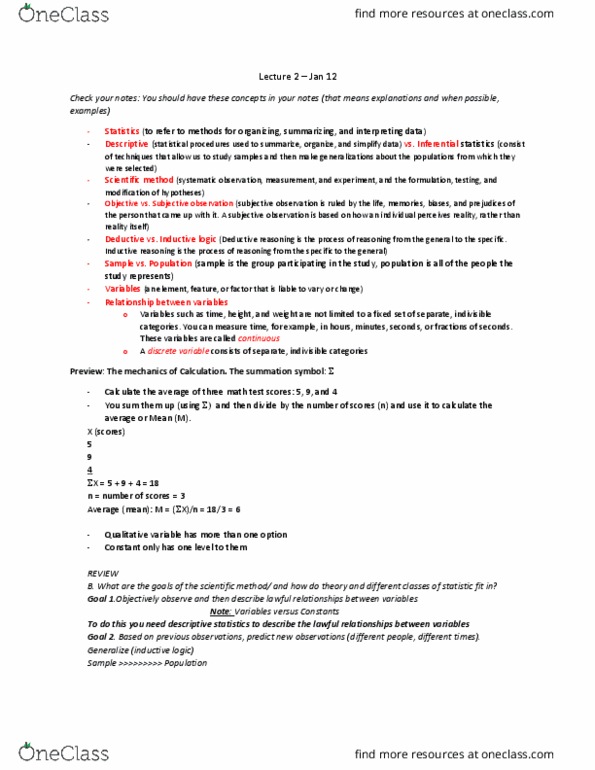
How to read histograms and frequency polygons! X means you need to sum (add up) all the x values ! Here we have the weights of 5 people! If we wanted to know the total weight of people, we would add all the weights together! X is the mathematical notation for adding all the score in a set together! Over the course of this class and the next you will calculate the mean, medium, mode, standard deviation, and the variance of the age of the members of your class sitting near you! Take a moment to collect the ages of at lease 4 people around you ! Recall that the goal of descriptive statistics is to summarize a collection of data in a clear and understandable way! Look at the shape of the distribution (chapter 2) ! Look at the central tendency of the distribution (chapter 4 ) ! Look at the variability of the distribution (chapter 4) !