SOAN 2120 Lecture Notes - Lecture 6: Null Hypothesis, Square Root, Multiple Choice

12 Feb 2017
School
Department
Course
Professor
Document Summary
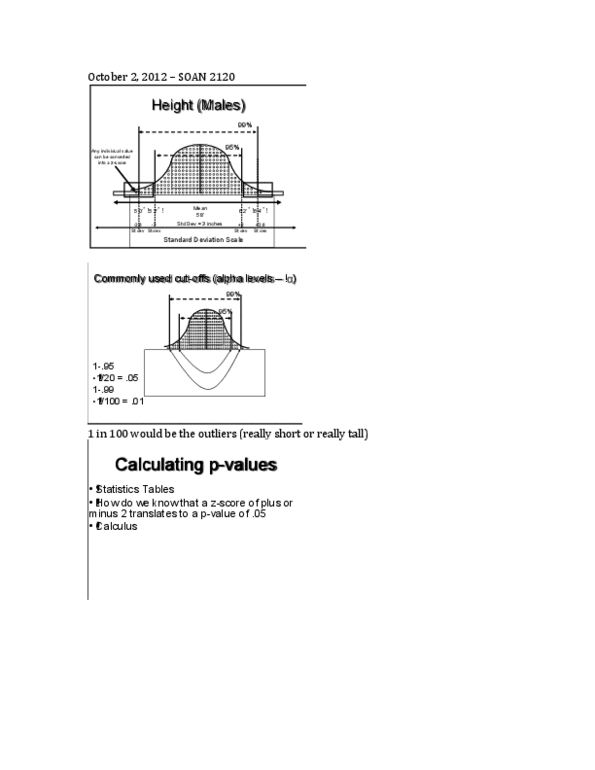
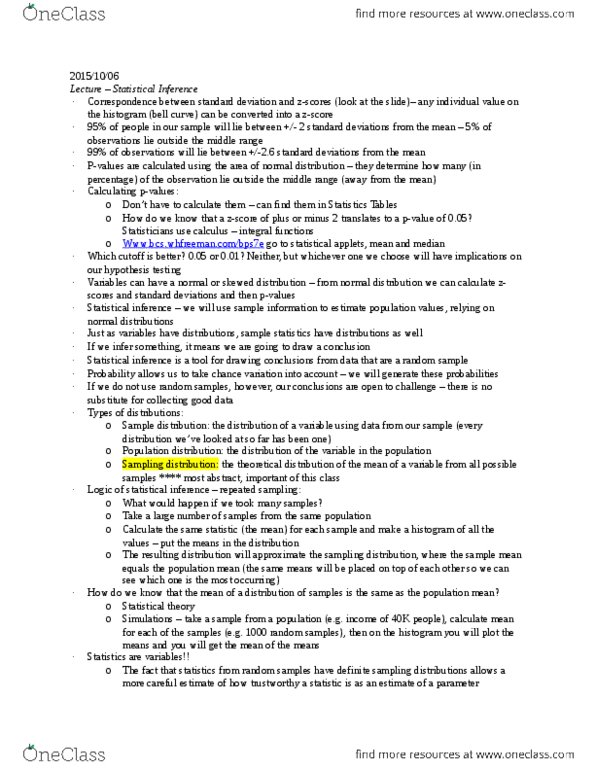
Able to identify the correspondence between z scores and p values. 5% will lie outside of the standard deviation (2. 5% will have a height less than 5"0 and 2. 5% will have a height more than 6"0) 3x2. 6 add to the mean and then subtract from the mean you end up with 99% of the people have a height in between 5-6"0 tall. Commonly used cut-offs (alpha levels- : 1-0. 95= 0. 05 (5%) 1/20, 1- 0. 99= 0. 01 (1%) 1/100. Summarizing distributions: normal distributions: social variables; bell curve distribution. Is a particular value different from the mean: statistical inference, using sample information to estimate population values, normal distribution, just as variables have distributions, sample statistics have distributions as well. If we infer something it means, we draw a conclusion. Statistical inference is a tool for drawing conclusions from data that are a random sample.