SOAN 2120 Lecture Notes - Lecture 6: Central Tendency, Ob River, Percentile

3 Sep 2015
School
Department
Course
Professor
Document Summary
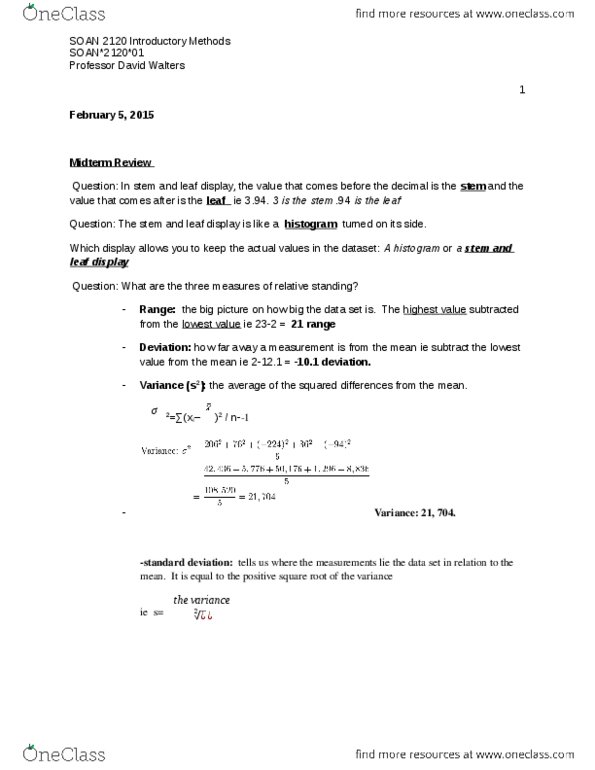
Distribution curves continued . (video) give a visual representation of data. Stem and leaf display common in manufacturing industries. Allows one to retain the actual obtained values. The numbers are placed in a pattern rather than in a box. ie the # of goals a goalie scores in a game 3. 94. Separate the 3. 94 3 is the stem . 94 is the leaf vertically list the stems in ascending order. Smallest at the top and largest at the number horizontally list of the leaf in ascending order from smallest to largest: key shows how to put the data back together key: 3|94 = 3. 94. Numerical methods: measures of central tendency: measures which describe and locate the central data. The average of the values in the data set. Add up all the numbers in the set and divide by the total numbers in the set ie 10 20 3 = 33/3 =11 mean. Median the middle number in the data set.