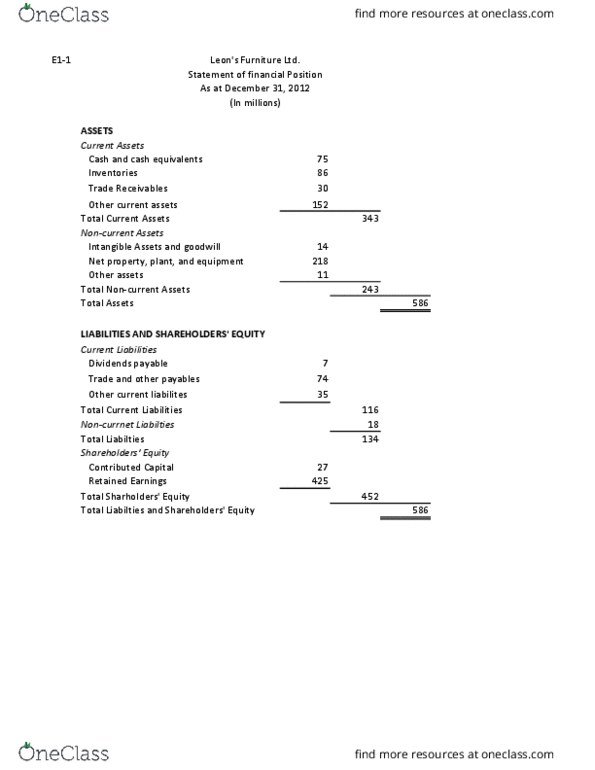
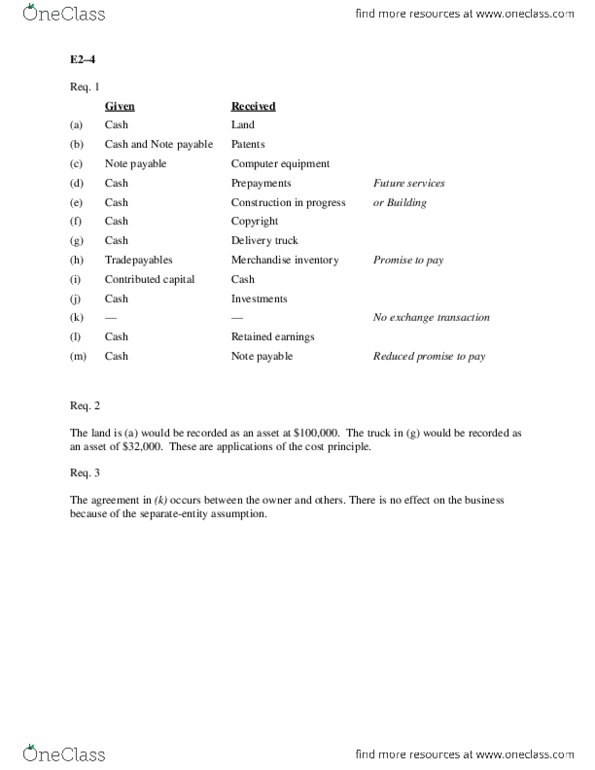
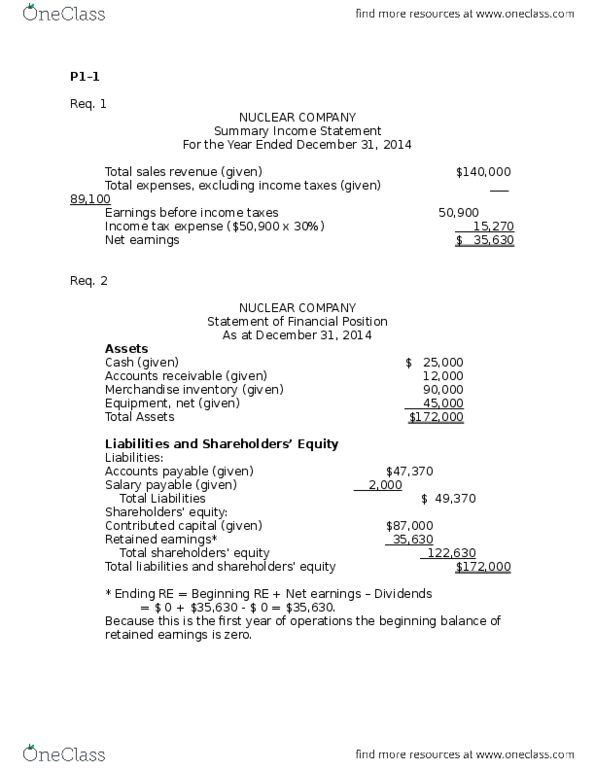
MGAB01H3 Lecture Notes - Lecture 2: Earnings Before Interest And Taxes, Balance Sheet, Retained Earnings


Get access


Related Documents
Related Questions
Compare Companies --- Netflix (NFLX) vs. GEO Holdings (TOK) Compute financial ratios, time value, variables, and returns using industry standard tools for optimizing financial success. Analyze corporate financial data in evaluating past and future financial performances.
Use formulas to calculate the following financial indicators for each year of data: Three fiscal years for Netflix and GEO Holdings for:
o Price to earnings ratio
o Debt to equity ratio
o Free cash flow
o Earnings per share
o Return on equity
o Net profit margin
V. Performance Over Time
A. Analyze the performance of the Netflix over time. What financial strengths and weaknesses does this company have? Consider addressing the free cash flows and ratios you calculated earlier.
B. Analyze the performance of your GEO Holdings over time. What financial strengths and weaknesses does this company have? Consider addressing the free cash flows and ratios you calculated earlier.
C. Analyze how the data differ between these two companies. Why do you think this is? Consider addressing the free cash flows and ratios you calculated earlier.
VI. Investment
A. Are the companies considered growth or value companies? Why?
B. Which companyâs stock is the better investment?
| Netflix Inc. (NMS: NFLX) | |||||
| Exchange rate used is that of the Year End reported date | |||||
| As Reported Annual Balance Sheet | |||||
| Report Date | 12/31/2016 | 12/31/2015 | 12/31/2014 | ||
| Currency | USD | USD | USD | ||
| Audit Status | Not Qualified | Not Qualified | Not Qualified | ||
| Consolidated | Yes | Yes | Yes | ||
| Scale | Thousands | Thousands | Thousands | ||
| Cash & cash equivalents | 1467576 | 1809330 | 1113608 | ||
| Short-term investments | 266206 | 501385 | 494888 | ||
| Current content library, net | - | - | 2125702 | ||
| Current content assets, net | 3726307 | 2905998 | - | ||
| Other current assets | 260202 | 215127 | 206271 | ||
| Total current assets | 5720291 | 5431840 | 3940469 | ||
| Non-current content library, net | - | - | 2773326 | ||
| Non-current content assets, net | 7274501 | 4312817 | - | ||
| Information technology assets | 185345 | 194054 | 189274 | ||
| Furniture & fixtures | 32185 | 30914 | 25758 | ||
| Building | 40681 | 40681 | 40681 | ||
| Leasehold improvements | 107945 | 107793 | 57339 | ||
| DVD operations equipment | 70152 | 88471 | 89144 | ||
| Capital work-in-progress | 108296 | 8845 | 12495 | ||
| Property & equipment, gross | 544604 | 470758 | 414691 | ||
| Less: accumulated depreciation | 294209 | 297346 | 264816 | ||
| Property & equipment, net | 250395 | 173412 | 149875 | ||
| Other non-current assets | 341423 | 284802 | 192981 | ||
| Total assets | 13586610 | 10202871 | 7056651 | ||
| Current content liabilities | 3632711 | 2789023 | 2117241 | ||
| Accounts payable | 312842 | 253491 | 201581 | ||
| Accrued expenses | 197632 | 140389 | 69746 | ||
| Deferred revenue | 443472 | 346721 | 274586 | ||
| Total current liabilities | 4586657 | 3529624 | 2663154 | ||
| Non-current content liabilities | 2894654 | 2026360 | 1575832 | ||
| Long-term debt | 3364311 | 2371362 | 900000 | ||
| Other non-current liabilities | 61188 | 52099 | 59957 | ||
| Total liabilities | 10906810 | 7979445 | 5198943 | ||
| Common stock | 1599762 | 1324809 | 60 | ||
| Additional paid-in capital | - | - | 1042810 | ||
| Foreign currency | -47966 | -42502 | -4615 | ||
| Change in unrealized gains on available for sale securities | -599 | -806 | 169 | ||
| Accumulated other comprehensive income (loss) | -48565 | -43308 | -4446 | ||
| Retained earnings (accumulated deficit) | 1128603 | 941925 | 819284 | ||
| Total stockholders' equity (deficiency) | 2679800 | 2223426 | 1857708 |
| Geo Holdings Corp (TOK: 2681) | |||||
| Due to changes with International Financial Reporting Standards (IFRS), recent financials statement presentations have been adjusted to meet this standard. Please note the original historical presentations have remained in the original format | |||||
| Exchange rate used is that of the Year End reported date | |||||
| As Reported Annual Balance Sheet | |||||
| Report Date | 03/31/2016 | 03/31/2015 | 03/31/2014 | ||
| Currency | JPY | JPY | JPY | ||
| Audit Status | Not Qualified | Not Qualified | Not Qualified | ||
| Consolidated | Yes | Yes | Yes | ||
| Scale | Millions | Millions | Thousands | ||
| Cash & deposits | 37683 | 32052 | 19869000 | ||
| Trade notes & accounts receivables | 4100 | 4077 | 3992000 | ||
| Merchandise | 24894 | 23834 | 23495000 | ||
| Deferred tax assets | 2156 | 1806 | 1773000 | ||
| Other current assets | 5462 | 7181 | 5942000 | ||
| Allowance for doubtful accounts | -281 | -292 | 343000 | ||
| Total current assets | 74015 | 68659 | 54729000 | ||
| Asset for rent, gross | 100974 | 104514 | 104647000 | ||
| Accumulated depreciation - asset for rent | -95154 | -97475 | 96055000 | ||
| Asset for rent, net | 5820 | 7038 | 8591000 | ||
| Buildings & structures, gross | 40872 | 39984 | 39478000 | ||
| Accumulated depreciation - buildings & structures | -27470 | -26362 | 25976000 | ||
| Buildings & structures, net | 13402 | 13622 | 13501000 | ||
| Land, net | 5844 | 6356 | 6651000 | ||
| Leased assets, gross | 2176 | 3519 | 4576000 | ||
| Accumulated depreciation - leased assets | -681 | -1764 | 2588000 | ||
| Leased assets, net | 1495 | 1754 | 1988000 | ||
| Other property, plant & equipment, gross | 24838 | 20562 | 17708000 | ||
| Accumulated depreciation - other property, plant & equipment | -18391 | -15292 | 13236000 | ||
| Other property, plant & equipment, net | 6447 | 5270 | 4471000 | ||
| Total property, plant & equipment | 33010 | 34043 | 35205000 | ||
| Total intangible assets | 1865 | 1277 | 2028000 | ||
| Investment securities | 926 | 1002 | 1266000 | ||
| Long-term loans receivable | 2250 | 6682 | 6628000 | ||
| Lease & guarantee deposits | 14905 | 14735 | 15034000 | ||
| Deferred tax assets | 3342 | 3774 | 2845000 | ||
| Other investments & other assets | 1222 | 1188 | 1760000 | ||
| Allowance for doubtful accounts | -1332 | -3751 | 3917000 | ||
| Total investments & other assets | 21315 | 23632 | 23617000 | ||
| Total non-current assets | 56192 | 58952 | 60851000 | ||
| Total assets | 130207 | 127612 | 115581000 | ||
| Trade accounts payable | 12631 | 13540 | 13124000 | ||
| Current portion of long-term borrowings | 8333 | 7097 | 8754000 | ||
| Current portion of bonds | 149 | 149 | 249000 | ||
| Income taxes payable | 4815 | 265 | 1170000 | ||
| Reserve for bonuses | 1665 | 1420 | 1135000 | ||
| Other current liabilities | 10135 | 12595 | 10279000 | ||
| Total current liabilities | 37731 | 35068 | 34713000 | ||
| Bonds | 105 | 254 | 403000 | ||
| Long-term borrowings | 19509 | 21843 | 13910000 | ||
| Lease liabilities | 1612 | 1660 | 1590000 | ||
| Deferred tax liabilities | 23 | 22 | 26000 | ||
| Asset retirement obligations | 4406 | 3994 | 3898000 | ||
| Other non-current liabilities | 1857 | 1554 | 1839000 | ||
| Total non-current liabilities | 27514 | 29329 | 21668000 | ||
| Total liabilities | 65246 | 64398 | 56381000 | ||
| Capital stock | 8871 | 8615 | 8603000 | ||
| Capital surplus | 3283 | 6090 | 6078000 | ||
| Retained earnings | 52542 | 49998 | 44381000 | ||
| Treasury shares | - | -1979 | 334000 | ||
| Total shareholders' equity | 64697 | 62724 | 58729000 | ||
| Valuation difference on available-for-sale securities | 166 | 282 | 297000 | ||
| Loss (gain) on deferred hedge | -15 | - | 297000 | ||
| Total accumulated other comprehensive income | 150 | 282 | 172000 | ||
| Stock acquisition rights | 113 | 206 | 59199000 | ||
| Net assets | 64961 | 63214 | 115581000 | ||
| Total liabilities & net assets | 130207 | 127612 |
| Netflix Inc. (NMS: NFLX) | |||||
| Exchange rate used is that of the Year End reported date | |||||
| As Reported Annual Income Statement | |||||
| Report Date | 12/31/2016 | 12/31/2015 | 12/31/2014 | ||
| Currency | USD | USD | USD | ||
| Audit Status | Not Qualified | Not Qualified | Not Qualified | ||
| Consolidated | Yes | Yes | Yes | ||
| Scale | Thousands | Thousands | Thousands | ||
| Revenues | 8830669 | 6779511 | 5504656 | ||
| Cost of revenues | 6029901 | 4591476 | 3752760 | ||
| Marketing expenses | 991078 | 824092 | 607186 | ||
| Technology & development expenses | 852098 | 650788 | 472321 | ||
| General & administrative expenses | 577799 | 407329 | 269741 | ||
| Operating income (loss) | 379793 | 305826 | 402648 | ||
| Interest expense | 150114 | 132716 | 50219 | ||
| Interest & other income (expense) | 30828 | -31225 | -3060 | ||
| Income before income taxes - United States | 188078 | 95644 | 325081 | ||
| Income (loss) before income taxes - foreign | 72429 | 46241 | 24288 | ||
| Income (loss) before income taxes | 260507 | 141885 | 349369 | ||
| Current tax provision (benefit) - federal | 54315 | 52557 | 86623 | ||
| Current tax provision (benefit) - state | 5790 | -1576 | 9866 | ||
| Current tax provision (benefit) - foreign | 60571 | 26918 | 16144 | ||
| Total current tax provision (benefit) | 120676 | 77899 | 112633 | ||
| Deferred tax provision (benefit) - federal | -24383 | -37669 | -10994 | ||
| Deferred tax provision (benefit) - state | -14080 | -17635 | -17794 | ||
| Deferred tax provision (benefit) - foreign | -8384 | -3351 | -1275 | ||
| Total deferred tax provision (benefit) | -46847 | -58655 | -30063 | ||
| Provision for (benefit from) income taxes | 73829 | 19244 | 82570 | ||
| Net income (loss) | 186678 | 122641 | 266799 | ||
| Weighted average shares outstanding - basic | 428822 | 425889 | 420546 | ||
| Weighted average shares outstanding - diluted | 438652 | 436456 | 431893 | ||
| Year end shares outstanding | 430054.212 | 427940.44 | 422910.887 | ||
| Net income (loss) per share - basic | 0.44 | 0.29 | 0.634 | ||
| Net income (loss) per share - diluted | 0.43 | 0.28 | 0.617 | ||
| Number of full time employees | 4500 | 3500 | 2189 | ||
| Number of part time & temporary employees | 200 | 400 | 261 | ||
| Total number of employees | 4700 | 3700 | 2450 | ||
| Number of common stockholders | 290 | 237 | 203 | ||
| Foreign currency translation adjustments | -5464 | -37887 | - | ||
| Geo Holdings Corp (TOK: 2681) | |||||
| Exchange rate used is that of the Year End reported date | |||||
| As Reported Annual Income Statement | |||||
| Report Date | 03/31/2016 | 03/31/2015 | 03/31/2014 | ||
| Currency | JPY | JPY | JPY | ||
| Audit Status | Not Qualified | Not Qualified | Not Qualified | ||
| Consolidated | Yes | Yes | Yes | ||
| Scale | Millions | Millions | Thousands | ||
| Total revenue | 267910 | 270308 | 262324000 | ||
| Cost of sales | -151798 | -157825 | 152301000 | ||
| Gross profit | 116112 | 112483 | 110022000 | ||
| Selling, general & administrative expenses | -99559 | -102925 | 100823000 | ||
| Operating income | 16552 | 9558 | 9198000 | ||
| Interest & dividend income | 49 | 114 | 111000 | ||
| Rental income | 1268 | 1167 | 1193000 | ||
| Other non-operating income | 1043 | 1062 | 453000 | ||
| Total non-operating income | 2361 | 2343 | 1758000 | ||
| Interest expense | -230 | -231 | 332000 | ||
| Rental expenses | -759 | -609 | 595000 | ||
| Transfer to reserve for doubtful account | - | -227 | - | ||
| Other non-operating expenses | -100 | -803 | - | ||
| Total non-operating expenses | -1089 | -1871 | 684000 | ||
| Ordinary income | 17824 | 10030 | 1612000 | ||
| Imapirment loss | -1319 | -1543 | 9344000 | ||
| Other extraordinary losses | -13 | - | 203000 | ||
| Total extraordinary losses | -1333 | -1543 | 203000 | ||
| Income before income taxes | 16491 | 8486 | 1218000 | ||
| Income taxes - current | -5779 | -2074 | 514000 | ||
| Income taxes - deferred | -147 | 925 | 87000 | ||
| Total income taxes | -5927 | -1149 | 1821000 | ||
| Profit | 10563 | 7337 | 7726000 | ||
| Profit attributable to owners of parent | 10563 | 7337 | 4027000 | ||
| Average number of shares outstanding - basic | 51.331 | 53.169 | -39000 | ||
| Average number of shares outstanding - diluted | 51.623 | 53.29 | 3987000 | ||
| Year end shares outstanding | 48.244 | 52.295 | 3738000 | ||
| Earnings per share - basic | 205.78 | 137.99 | -70000 | ||
| Earnings per share - diluted | 204.62 | 137.68 | 3808000 | ||
| Number of full time employees | 3825 | 3579 | 53996.5 | ||
| Number of part time employees | 10421 | 10114 | 54066.499 | ||
| Number of common stockholders | 57105 | 65030 | 53996.5 | ||

Selected year-end financial statements of Cabot Corporationfollow. (All sales were on credit; selected balance sheet amountsat December 31, 2012, were inventory, $51,900; total assets,$179,400; common stock, $105,000; and retained earnings,$52,148.)
| CABOT CORPORATION Income Statement For Year Ended December 31, 2013 | ||
| Sales | $ | 451,600 |
| Costof goods sold | 297,150 | |
| Gross profit | 154,450 | |
| Operating expenses | 99,300 | |
| Interest expense | 4,700 | |
| Income before taxes | 50,450 | |
| Income taxes | 20,323 | |
| Netincome | $ | 30,127 |
| CABOT CORPORATION Balance Sheet December 31, 2013 | ||||||
| Assets | Liabilities and Equity | |||||
| Cash | $ | 20,000 | Accounts payable | $ | 15,500 | |
| Short-term investments | 9,000 | Accrued wages payable | 3,800 | |||
| Accounts receivable, net | 32,800 | Income taxes payable | 4,100 | |||
| Notes receivable (trade)* | 4,500 | Long-term note payable, secured | ||||
| Merchandise inventory | 42,150 | by mortgage on plant assets | 65,400 | |||
| Prepaid expenses | 3,000 | Common stock | 105,000 | |||
| Plant assets, net | 147,300 | Retained earnings | 64,950 | |||
| Total assets | $ | 258,750 | Total liabilities and equity | $ | 258,750 | |
| * These areshort-term notes receivable arising from customer (trade)sales. |
| Required: |
Compute the following: (1) current ratio, (2) acid-test ratio,(3) days' sales uncollected, (4) inventory turnover, (5) days'sales in inventory, (6) debt-to-equity ratio, (7) times interestearned, (8) profit margin ratio, (9) total asset turnover, (10)return on total assets, and (11) return on common stockholders'equity. (Use 365 days a year. Do not round intermediatecalculations.) |

Complex Balance Sheet
Presented below is the unaudited balance sheet as of December31, 2016, prepared by Zeus Manufacturing Corporationâsbookkeeper.
| Zeus Manufacturing Corporation Balance Sheet for the Year Ended December 31, 2016 | ||||
| Assets | Liabilities and Shareholders' Equity | |||
| Cash | $225,000 | Accounts payable | $133,800 | |
| Accounts receivable (net) | 345,700 | Mortgage payable | 900,000 | |
| Inventories | 560,000 | Notes payable | 500,000 | |
| Prepaid income taxes | 40,000 | Lawsuit liability | 80,000 | |
| Investments | 57,700 | Income taxes payable | 61,200 | |
| Land | 450,000 | Deferred tax liability | 28,000 | |
| Building | 1,750,000 | Accumulated depreciation | 420,000 | |
| Machinery and equipment | 1,964,000 | Total Liabilities | $2,123,000 | |
| Goodwill | 37,000 | Common stock, $50 par; 40,000 shares issued | $2,231,000 | |
| Total Assets | $5,429,400 | Retained earnings | 1,075,400 | |
| Total Shareholders' Equity | $3,306,400 | |||
| Total Liabilities and Shareholders' Equity | $5,429,400 | |||
Your company has been engaged to perform an audit, during whichyou discover the following information:
Checks totaling $14,000 in payment of accounts payable weremailed on December 31, 2016, but were not recorded until 2017. Latein December 2016, the bank returned a customerâs $2,000 checkmarked "NSF," but no entry was made. Cash includes $100,000restricted for building purposes.
Included in accounts receivable is a $30,000 note due onDecember 31, 2019, from Zeusâs president.
During 2016, Zeus purchased 500 shares of common stock of amajor corporation that supplies Zeus with raw materials. Total costof this stock was $51,300, and fair value on December 31, 2016, was$47,000. The decline in fair value is considered temporary. Zeusplans to hold these shares indefinitely.
Treasury stock was recorded at cost when Zeus purchased 200 ofits own shares for $32 per share in May 2016. This amount isincluded in investments.
On December 31, 2016, Zeus borrowed $500,000 from a bank inexchange for a 10% note payable, maturing December 31, 2021. Equalprincipal payments are due December 31 of each year beginning in2017. This note is collateralized by a $250,000 tract of landacquired as a potential future building site, which is included inland.
The mortgage payable requires $50,000 principal payments, plusinterest, at the end of each month. Payments were made on January31 and February 28, 2017. The balance of this mortgage was due June30, 2017. On March 1, 2017, prior to issuance of the auditedfinancial statements, Zeus consummated a noncancelable agreementwith the lender to refinance this mortgage. The new terms require$100,000 annual principal payments, plus interest, on February 28of each year, beginning in 2018. The final payment is due February28, 2025.
The lawsuit liability will be paid in 2017.
Of the total deferred tax liability, $5,000 is considered acurrent liability.
The current income tax expense reported in Zeusâs 2016 incomestatement was $61,200.
The company was authorized to issue 100,000 shares of $50 parvalue common stock.
Required:
Prepare a corrected classified balance sheet as of December 31,2016.
| Zeus Manufacturing Corporation Balance Sheet December 31, 2016 | |||
| Assets | |||
| Current Assets: | |||
| Cash | $ | ||
| Accounts receivable (net) | |||
| Inventories | |||
| Total current assets | $ | ||
| Long-Term investment, at fair value | |||
| Property, Plant, and Equipment (at cost): | |||
| Land | $ | ||
| Building | $ | ||
| Machinery and equipment | |||
| Total | |||
| Less: Accumulated depreciation | |||
| Total property, plant, and equipment | |||
| Intangible Asset: | |||
| Goodwill | |||
| Other Assets: | |||
| Cash restricted for building purposes | $ | ||
| Officer's note receivable | |||
| Land held for future building site | |||
| Total Assets | $ | ||
| Liabilities | |||
| Current Liabilities: | |||
| Accounts payable | $ | ||
| Current installments of long-term debt | |||
| Lawsuit liability | |||
| Income taxes payable | |||
| Deferred tax liability | |||
| Total current liabilities | $ | ||
| Long-Term Debt: | |||
| Mortgage payable | $ | ||
| Notes payable | |||
| Deferred tax liability | |||
| Total long-term debt | |||
| Total Liabilities | $ | ||
| Shareholders' Equity | |||
| Contributed Capital: | |||
| Common stock, $50 par value | $ | ||
| Additional paid-in capital | |||
| Total paid-in capital | $ | ||
| Retained earnings | |||
| Accumulated Other Comprehensive Loss: | |||
| Unrealized decrease in value of long-term investment | |||
| Total | $ | ||
| Less: Cost of treasury stock | |||
| Total Shareholders' Equity | |||
| Total Liabilities and Shareholders' Equity | $ | ||
