STAB57H3 Lecture Notes - Lecture 2: Foreach Loop


Document Summary
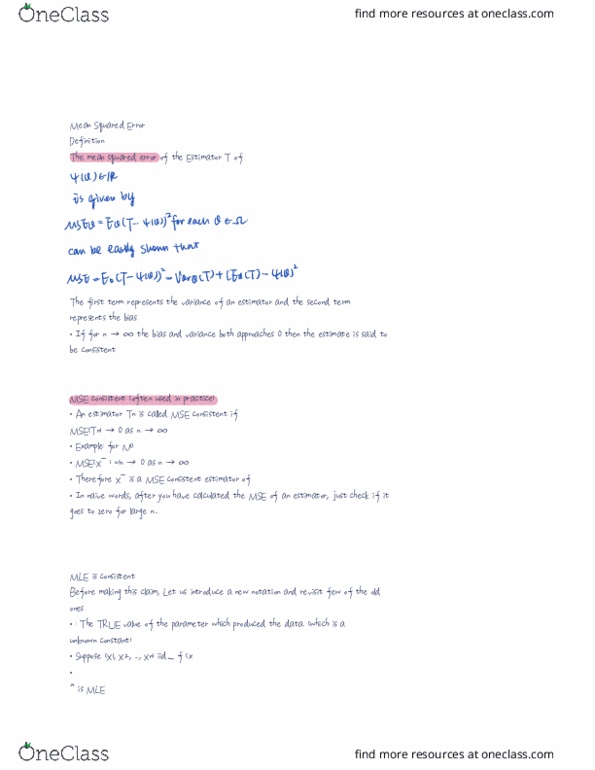
If the probability measure p can all be represented using probability f functions or density functions (for simplicity, let us not distinguish the discrete and continuous case for the time being), then it is common to write the statistical model as { f for which. Using the observed data, we may wish to estimate the true value of that are likely to contain the true value , construct small region in or assess whether or not the data are in agreement with some particular value of 0, suggested as being the true value. = [0, 1] is the set of all possible values of the parameter , one of which is the true value. The joint probability function of the sample (or statistical model for the sample) is. An example of the response variable could be heights in centimeters of. Exercise: a sample (x1, x2: , xn) is generated from a geometric( ) n.