ECO220Y1 Lecture Notes - Lecture 5: Analysis Of Variance, Total Variation, Summary Statistics


27
ECO220Y1 Full Course Notes
Verified Note
27 documents
Document Summary
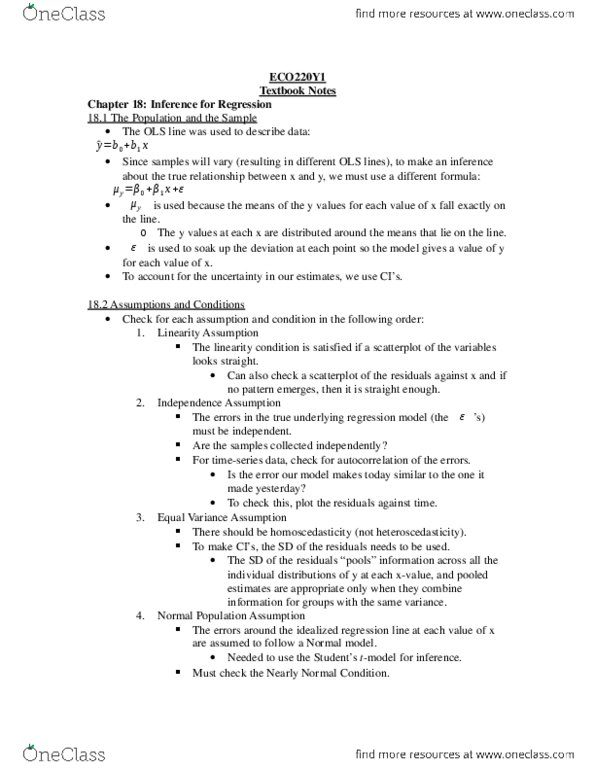
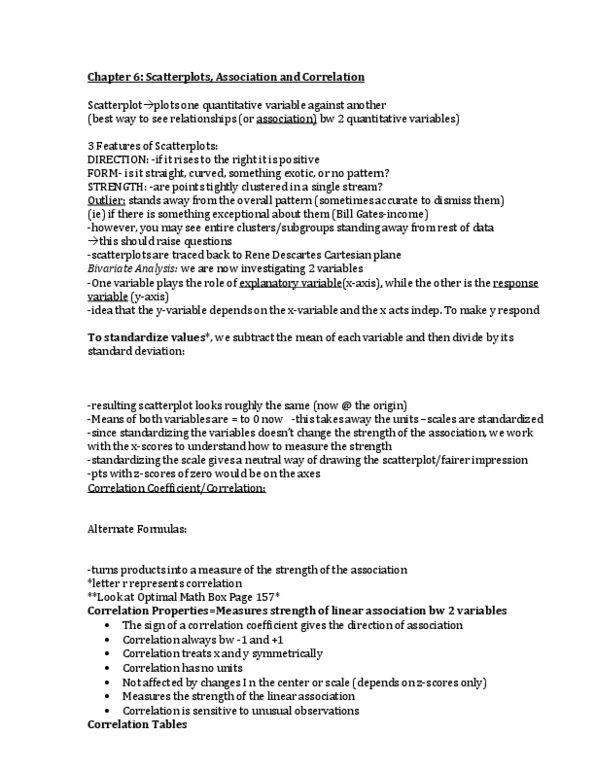
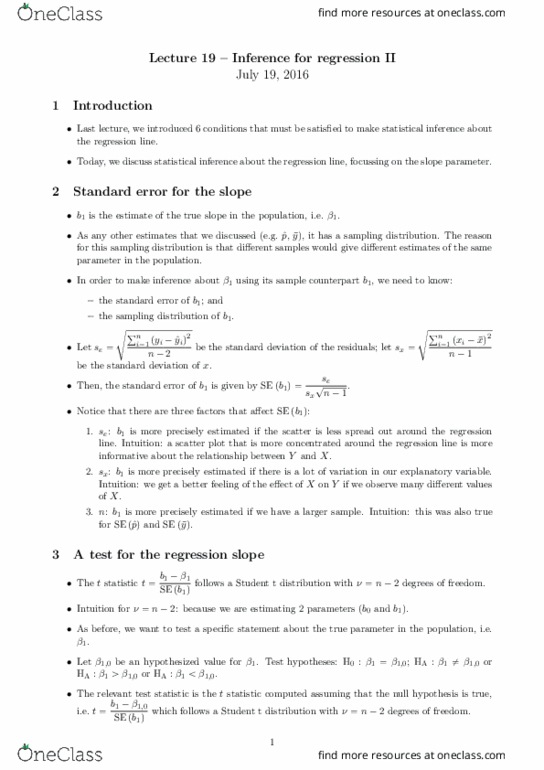
Explanatory/rhs variable on x-axis, predicted/lhs variable on y-axis. Line of best fit (least squares line): sum of squared residuals is smallest. Minimizes sse (sum of squared errors: = predicted value. Ols line is not the same as geometric line. Commonly called regression line, ordinary least squares (ols) Quantitative method to fit line through scatter diagram. Mean = 0 b1 = r * sy/sx b1 = r: y = rzx b0 = 0. For every standard deviation above mean, obtain y-value that is r standard deviations above mean. Regression to the mean: since r cannot be greater than 1, if x is 1 standard deviation from mean, y must be 1 standard deviation or less from mean. Each corresponding y is closer to the mean (in terms of standard deviation) than corresponding x. One correlation coefficient for every x and y. Two regressions, depending on which is the explanatory variable. Root mean square error (standard error of estimate):