ECO100Y1 Lecture Notes - Lecture 14: Hotdog, Investment Goods

Get access


Related textbook solutions


Related Documents
Related Questions
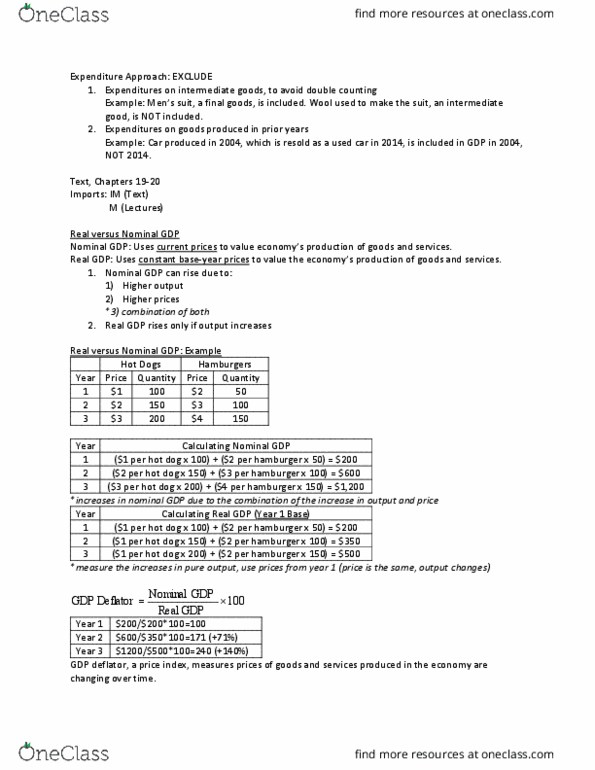
Table 24-7. The table below applies to an economy with only two goods â hamburgers and hot dogs. The fixed basket consists of 4 hamburgers and 8 hot dogs.
| Year | Price of hamburgers | Price of hot dogs |
| 2009 | $5 | $3 |
| 2010 | 5.50 | 3.30 |
| 2011 | 5.61 | 3.63 |
Refer to Table 24-7. Between 2009 and 2011, the cost of living increased by
| ||||||||||||||||||||||||||||||||||
| ||||||||||||||||||||||||||||||||||
| ||||||||||||||||||||||||||||||||||
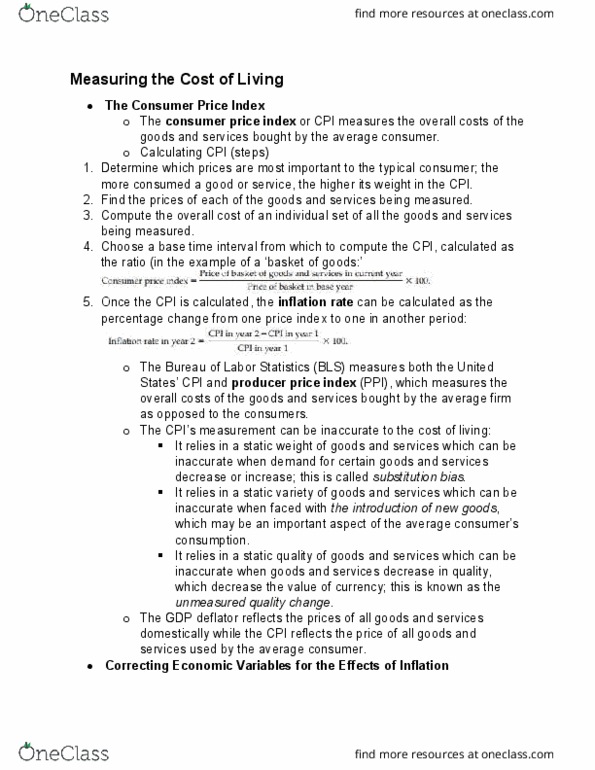
The CPI is more commonly used as a gauge of inflation than the GDP deflator is because
|
Three goods are consumed in an economy during years 1 and 2. The table shows prices (P1 and P2) for each good, and it shows the market basket that is used to calculate the consumer price index. The base year is year 1.
|
Good |
P1 |
P2 |
Basket |
|
Milk (gallons) |
$4 |
$4.20 |
4 |
|
Chicken (pounds) |
$5 |
$5.50 |
10 |
|
Onions (bags) |
$2 |
$2.32 |
1 |
Enter numbers in each blank, rounded to two decimal places as necessary. The cost of the basket in year 1 is $____ and the cost of the basket in year 2 is $_____. The value of the CPI in year 1 is _____ and the value of the CPI in year 2 is ______. The inflation rate is equal to ______%.

