Biology 2244A/B Lecture Notes - Lecture 5: Statistical Inference, Statistic, Standard Deviation

2 Jan 2017
School
Department
Course
Professor
Document Summary
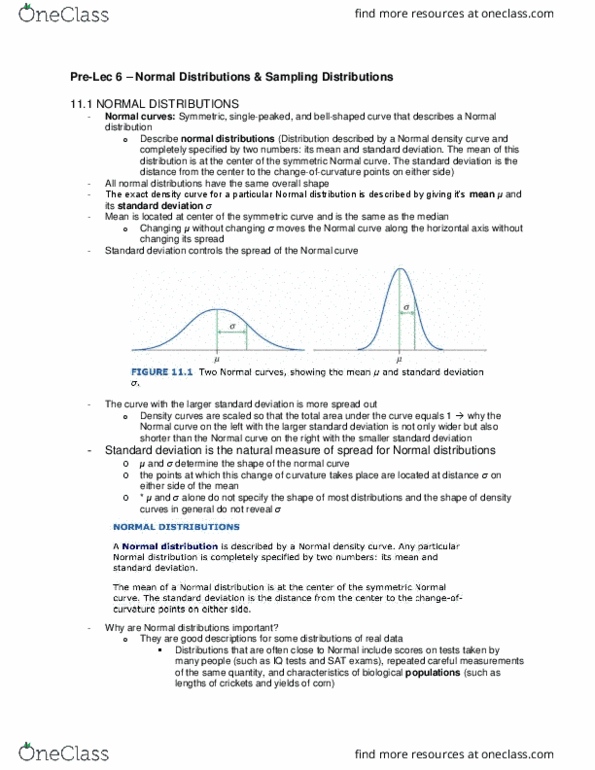
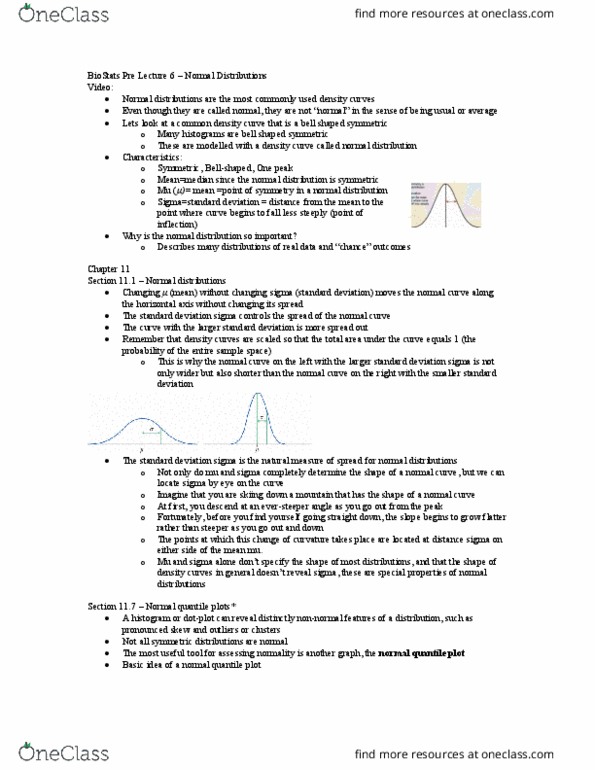
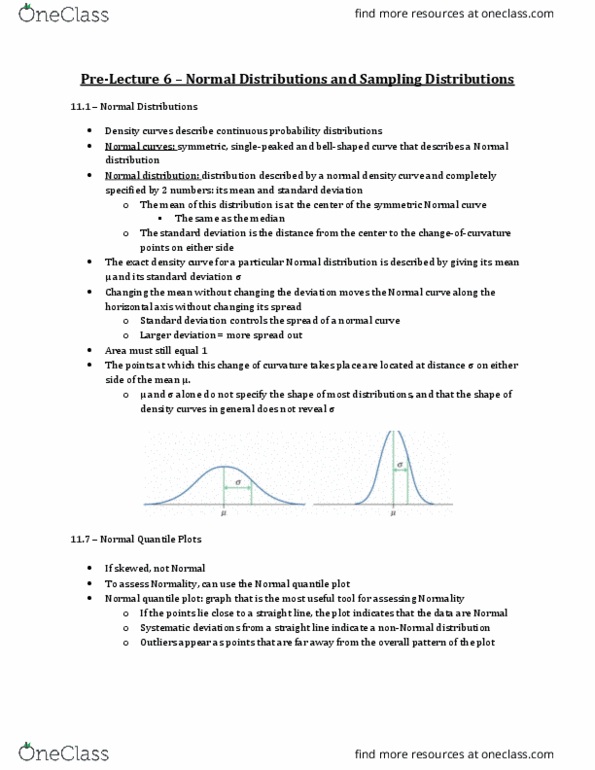
Normal curves are symmetric, single-peaked, and bell-shaped. The exact density curve for a particular normal distribution is described by giving its mean (mu) and its standard deviation (sigma) Mean is located at the center of the curve and is the same as the median. Changing mean without changing standard deviation moves the normal curve along the horizontal axis. Standard deviation controls the spread of a normal curve. Curve with a larger standard deviation is more spread out. Density curves are scaled so that the total area under the curve equals 1. Standard deviation: the points at which a change in curvature takes place are located at a distance on either side of the mean. Normal distributions are good descriptions for some distributions of real data: e. g. test scores, repeated measurements of the same quantity, characteristics of biological populations. Normal distributions are good approximations to the results of many kinds of chance outcomes: e. g. proportion of boys in many hospital births.