Health Sciences 3801A/B Lecture Notes - Lecture 1: Statistical Inference, Categorical Variable, Bar Chart

11 Feb 2019
School
Department
Course
Professor

Document Summary
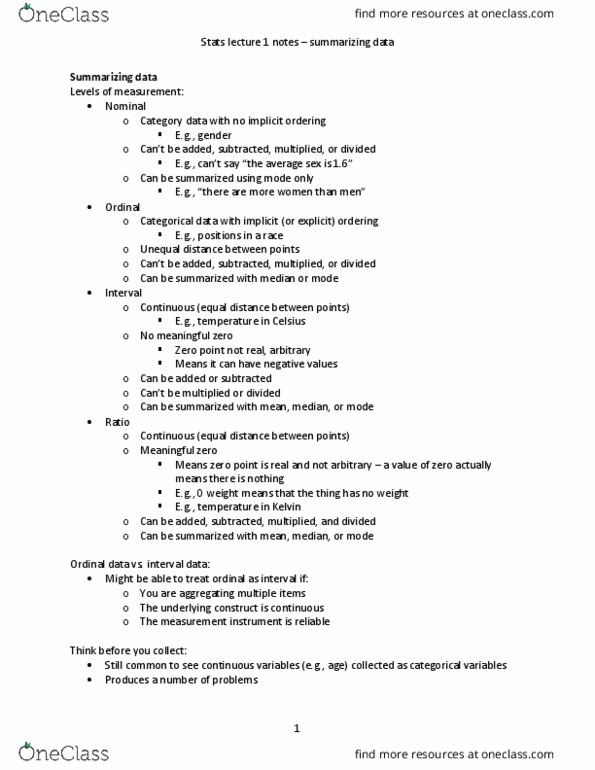
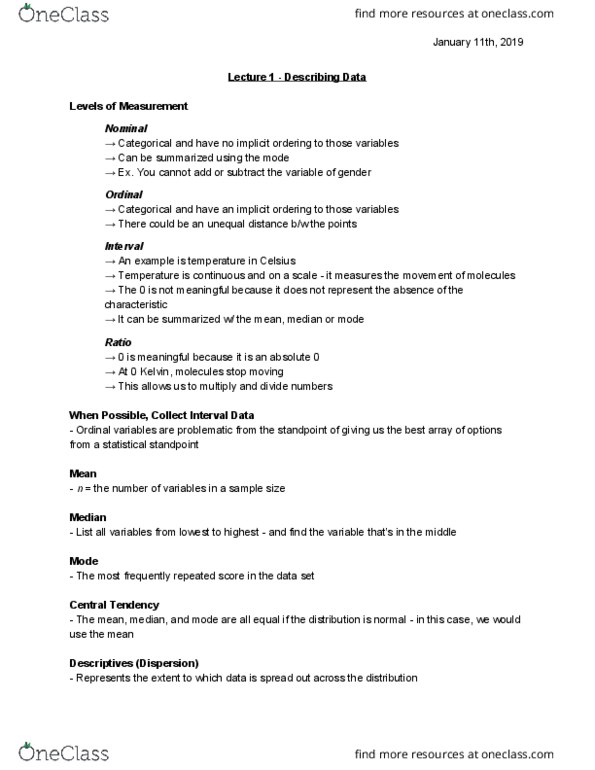
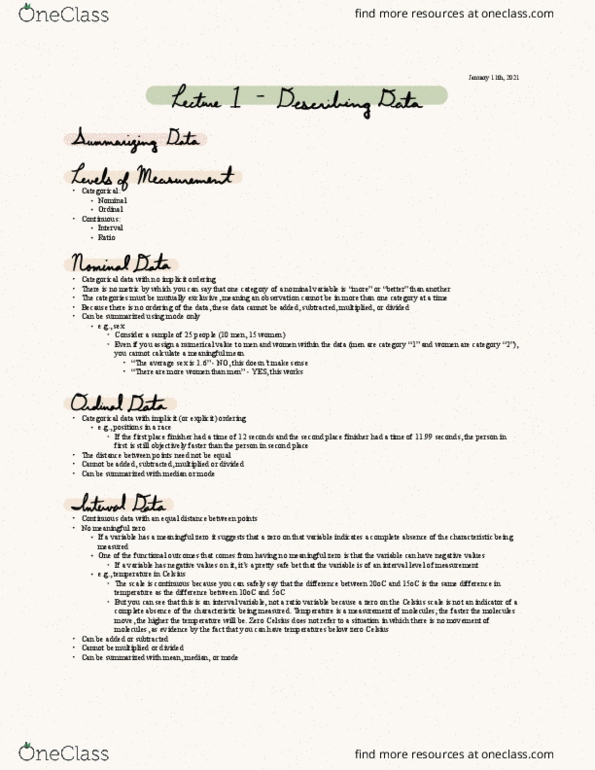
Lowest precision to highest precision: nominal, ordinal, interval, ratio, wherever possible, collect interval data! Descriptives (central tendency: mean, the arithmetic average of data, sum of all data divided by number of units (n, median, the point that divides data in half; 50th percentile, mode (n+1) 2, the more frequently occurring value. If distribution is normal (i. e. , bell-shaped), the mean, median, and mode are all equal. In majority of inferential statistics, we use the mean. Standard deviation: value that shows the relation that individual scores have to the mean of the sample. For populations, s for samples. Coefficient of variation the sd of a measure is dependent upon it"s scale (i. e. , the magnitude of the values within the data) If you need to compare the dispersion of two different scales (or samples), it is worthwhile to make the comparison scaleless. The coefficient of variation facilitates this type of comparison.