Nursing 3340A/B Lecture Notes - Lecture 11: Homoscedasticity, Structural Equation Modeling, Logistic Regression

8 Dec 2016
School
Department
Course
Professor
Document Summary
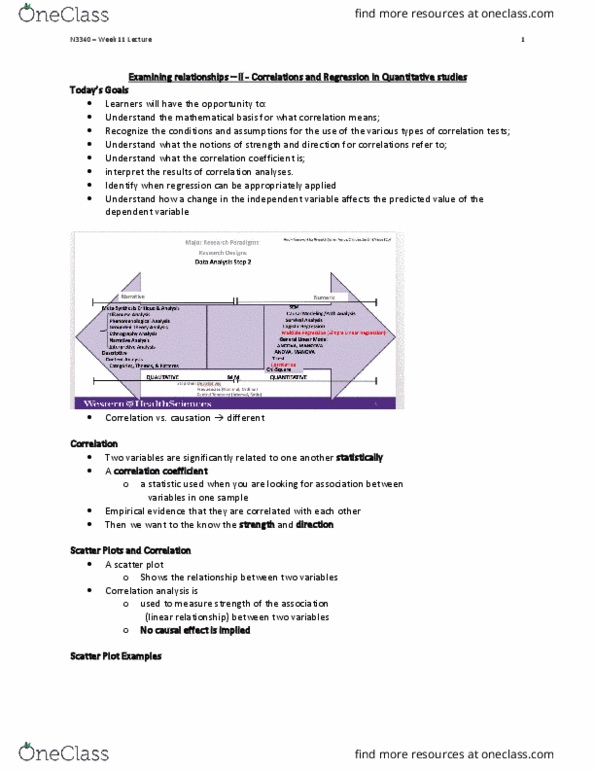
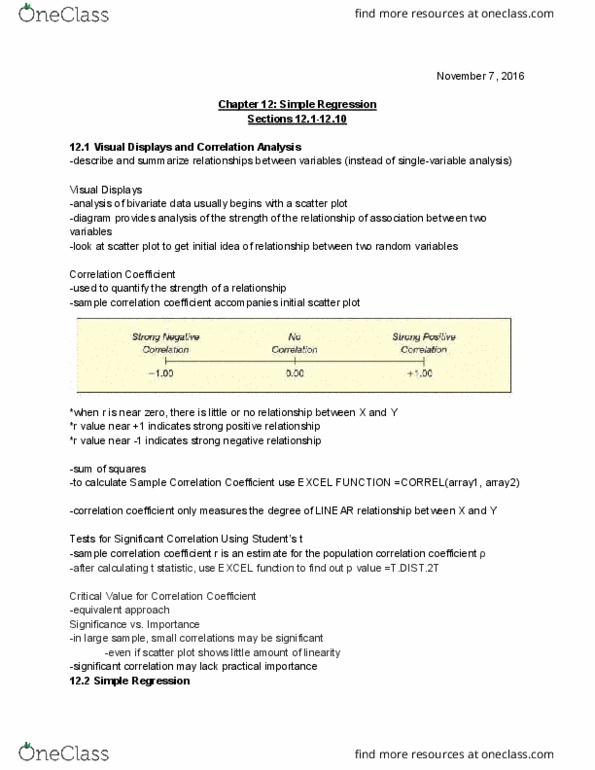
Examining relationships ii - correlations and regression in quantitative studies. Regression and correlation analyses study the relationships between variables. This area of statistics was started in the 1860s by francis galton (1822-1911) who was also dar(cid:449)i(cid:374)"s cousi(cid:374) A correlation means that two things are significantly related to one another mathematically. A correlation coefficient is a statistic used when you are looking for a relationship or association between variables in one sample. A scatter plot (or scatter diagram) is used to show the relationship between two variables. Correlation analysis is used to measure strength of the association (linear relationship) between two variables (there is no cause: only concerned with strength of the relationship, no causal effect is implied. Correlations only describe a mathematical relationship between two variables, they do not prove cause and effect. Correlation is a necessary, but not a sufficient condition for determining causality. Three key requirements to infer a causal relationship: 1.