Political Science 3324F/G Lecture 10: Week 10

21 Mar 2019
School
Department
Professor
Document Summary
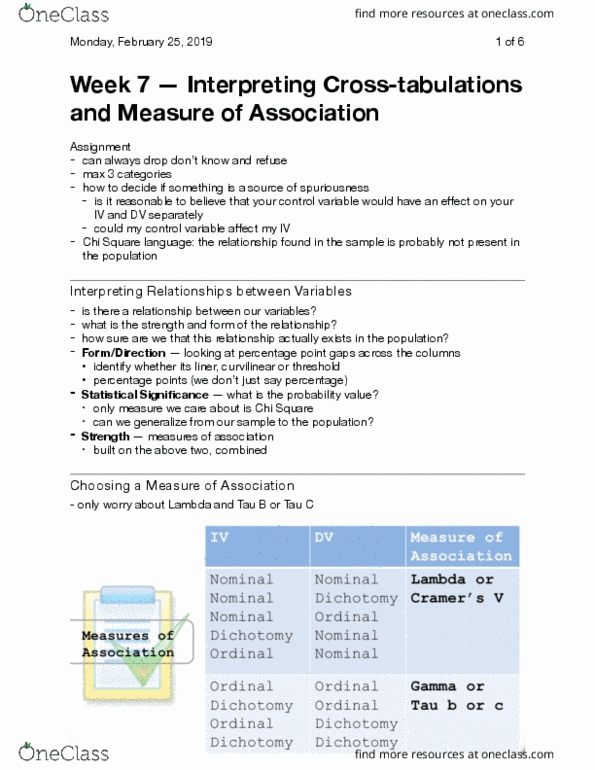
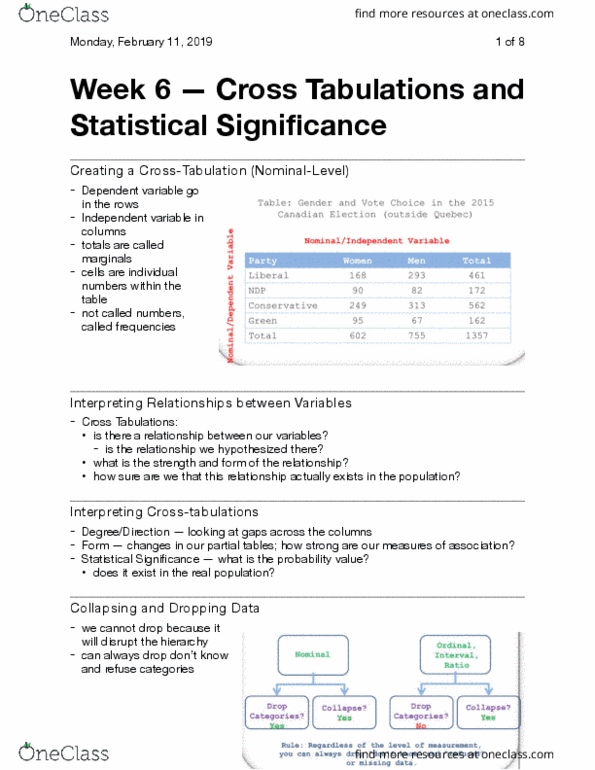
All tables must be related back to hypothesis. General statement yes or no support for hypothesis. Linear/curvilinear or threshold: linear is the best because it means there is a direct relationship between independent and dependent variable. Percentage point gaps: describe trends as you see them on the table. Look at measures of association: look at tau b, c or lambda, with a tau-b of . 14 there is a weak relationship between the independent and dependent variable . Is there support for the hypothesis: strong, moderate, weak, none. Rather than making a blanket statement about hypothesis support. Last sentence before you move onto control variable 2. This is a source of spuriousness, partial source of spuriousness, an intervening variable or. Parametric refers to whether the test relies on assumptions about the distribution of the data. Tests that are drawn from a normally distributed population.