Psychology 2800E Lecture 10: PSYCH 2840: Lecture 10

16 Dec 2015
School
Department
Course
Professor
Document Summary
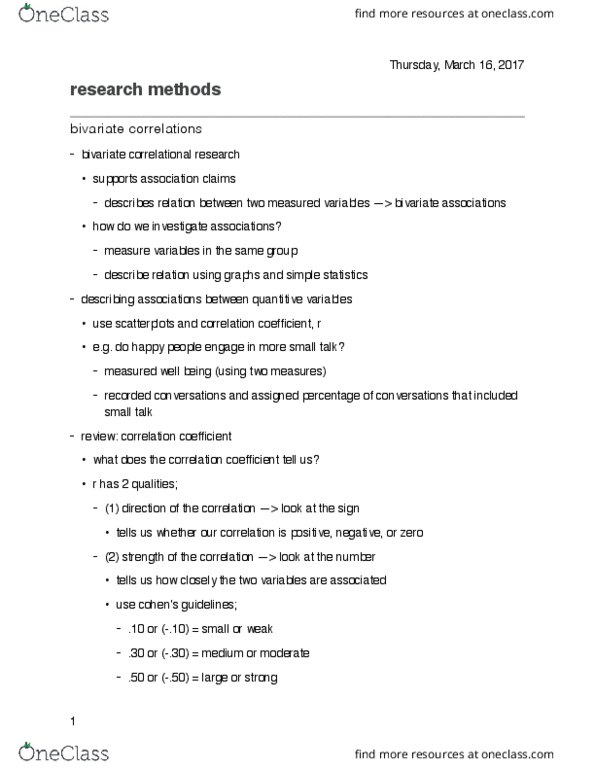
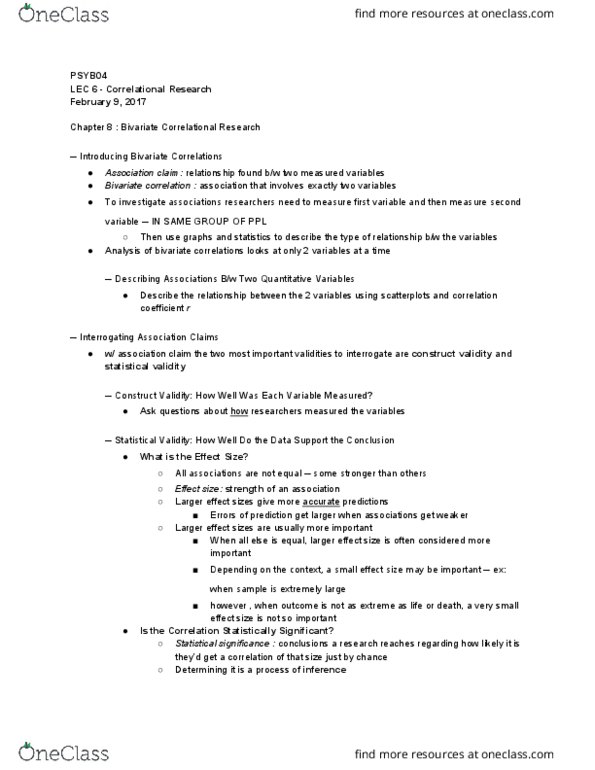
Supports association claims: measure variables in the same group, describe relation using graphs and simple statistics, describes relation between two measured variables. Correlational research = association claims: how to variables are related. E. g. , do happy people engage in more small talk: measured well-being (used two measures) Level of chitchat included small talk: recorded conversations and assigned percentage of conversations that. Is this a positive, negative, zero or curvilinear association: negative. The researchers found that the association was r = -0. 33, p < 0. 5. How would you describe the results: there is a negative correlation between mall talk and well-being, r = -0. 33, p < 0. 5, such that the more small talk participants engaged in the lower their well-being: statistically significant reject the null. Note: it doesn"t matter which variable you put on the y- What does the correlation coefficient tell us: r has two qualities: axis. e, direction of correlation -> look at the sign.