Statistical Sciences 1024A/B Lecture Notes - Lecture 2: Quartile, Box Plot, Interquartile Range

14 May 2016
School
Department
Professor
Document Summary
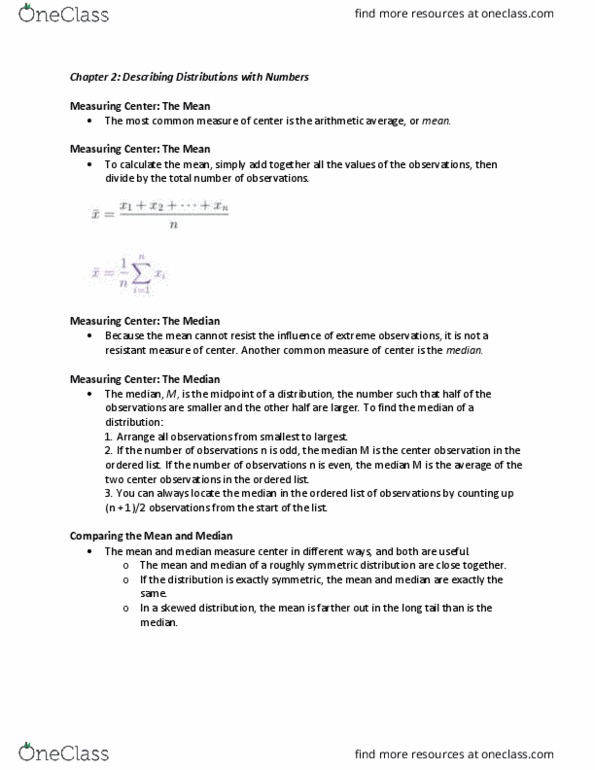
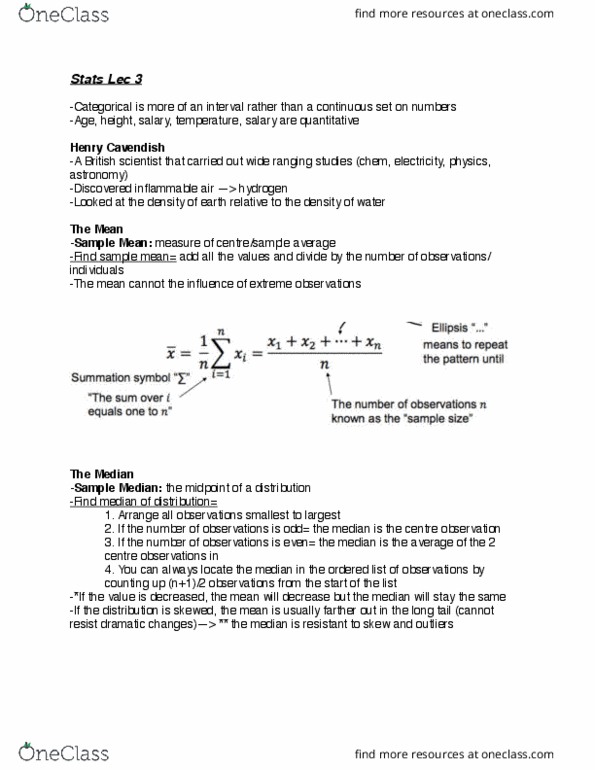
Chapter 2: describing distributions with numbers: mean. To calculate the average, or mean, add all values, then divide by the number of individuals: median. It is the midpoint of distribution, the number such that half the observations are smaller and other half is larger. Finding the median: odd # of observations: middle/ center observation in the ordered list, even # of observations: mean of the two center observations in the ordered list, quartiles. First quartile q1: median of the observations to the left of the overall median/ first half of ordered data. Third quartile q3: median of the observations to the right of the overall median/ second half of ordered data: comparing mean and median. Symmetric distribution: mean and median are exactly the same. Left/right skewed: mean is usually farther out in the tail than the median. Median is resistant to skew and outliers, the mean is not: five-number summary.