ECON 261 Lecture Notes - Lecture 1: Saw Ii

Document Summary
Get access


Related Documents

Related Questions
|
A |
B |
C |
D |
E |
|
|
1 |
|||||
|
2 |
|||||
|
3 |
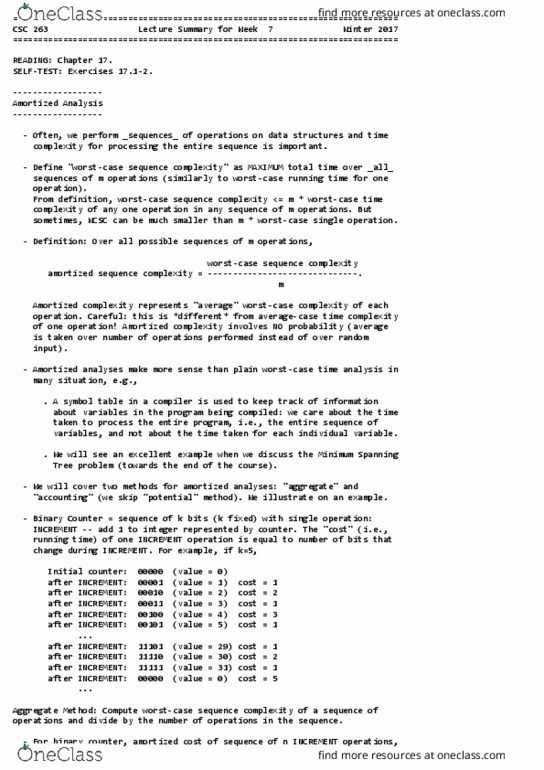
Date |
Price of gas |
|||
|
4 |
Jan 07, 2008 |
325.3 |
|||
|
5 |
Jan 14, 2008 |
323.9 |
|||
|
6 |
Jan 21, 2008 |
320.1 |
|||
|
7 |
Jan 28, 2008 |
316.3 |
|||
|
8 |
Feb 04, 2008 |
313.5 |
|||
|
9 |
Feb 11, 2008 |
310.7 |
|||
|
10 |
Feb 18, 2008 |
315.4 |
|||
|
11 |
Feb 25, 2008 |
324.6 |
|||
|
12 |
Mar 03, 2008 |
325.2 |
|||
|
13 |
Mar 10, 2008 |
326.3 |
|||
|
14 |
Mar 17, 2008 |
333.7 |
|||
|
15 |
Mar 24, 2008 |
332.1 |
|||
|
16 |
Mar 31, 2008 |
334.8 |
|||
|
17 |
Apr 07, 2008 |
336.6 |
|||
|
18 |
Apr 14, 2008 |
341.6 |
|||
|
19 |
Apr 21, 2008 |
355 |
|||
|
20 |
Apr 28, 2008 |
366.9 |
|||
|
21 |
May 05, 2008 |
367.7 |
|||
|
22 |
May 12, 2008 |
376.4 |
|||
|
23 |
May 19, 2008 |
384.9 |
|||
|
24 |
May 26, 2008 |
397.5 |
|||
|
25 |
Jun 02, 2008 |
402.6 |
|||
|
26 |
Jun 09, 2008 |
407 |
|||
|
27 |
Jun 16, 2008 |
411.8 |
|||
|
28 |
Jun 23, 2008 |
411 |
|||
|
29 |
Jun 30, 2008 |
411.3 |
|||
|
30 |
Jul 07, 2008 |
412.3 |
|||
|
31 |
Jul 14, 2008 |
411.7 |
|||
|
32 |
Jul 21, 2008 |
408.4 |
|||
|
33 |
Jul 28, 2008 |
400.2 |
|||
|
34 |
Aug 04, 2008 |
393.9 |
|||
|
35 |
Aug 11, 2008 |
386.6 |
|||
|
36 |
Aug 18, 2008 |
376.4 |
|||
|
37 |
Aug 25, 2008 |
371.5 |
|||
|
38 |
Sep 01, 2008 |
369.8 |
|||
|
39 |
Sep 08, 2008 |
367.1 |
|||
|
40 |
Sep 15, 2008 |
373 |
|||
|
41 |
Sep 22, 2008 |
368 |
|||
|
42 |
Sep 29, 2008 |
362.7 |
|||
|
43 |
Oct 06, 2008 |
351.7 |
|||
|
44 |
Oct 13, 2008 |
323.9 |
|||
|
45 |
Oct 20, 2008 |
305 |
|||
|
46 |
Oct 27, 2008 |
286.1 |
|||
|
47 |
Nov 03, 2008 |
265.4 |
|||
|
48 |
Nov 10, 2008 |
247.7 |
|||
|
49 |
Nov 17, 2008 |
229.4 |
|||
|
50 |
Nov 24, 2008 |
212.8 |
|||
|
51 |
Dec 01, 2008 |
203 |
|||
|
52 |
Dec 08, 2008 |
191.8 |
|||
|
53 |
Dec 15, 2008 |
181 |
|||
|
54 |
Dec 22, 2008 |
178.1 |
|||
|
55 |
Dec 29, 2008 |
174.1 |
QUESTION 13
Label the next column (D) "6-month change." Here we will calculate how much prices have changed since the price six months ago. For example, if the price on January 1 were 224.1 and the price on July 1 is 324.1, the price change is 100. We can't calculate how much prices have changed over the past six months for the first half of 2008 because we don't know the price six months before. So, in column D, put an x in each cell for which we can't calculate the 6-month change. Starting in July, we can calculate the 6-month change. Using cell references, enter here the formula you should enter into cell D30 to calculate the 6-month change.
2 points
QUESTION 14
Copy and paste the formula from cell D30 (from the last question) into cells D31 to D55. What formula is now in cell D48?
2 points
QUESTION 15
What value is now in cell D50?
1 point
QUESTION 16
Label the next column (E) "% of Jan." In this column, we will divide every week's price by the price from January 7th. This will tell us as a percent how prices compare to their level at the start of the year. This time, we want an "absolute" reference so that it doesn't consider the position (i.e. "8 to the left and 2 down") but just locks in on B4 every time. To set up an absolute reference in a formula, we put the $ character into the reference, so instead of B4, we use $B$4. With the dollar signs in place, you can copy the formula and paste it, and in each case, it will go back to B4 regardless of where you are when you paste it. What formula should you type into cell E5 to get the "% of Jan" for January 14, 2008? Remember to use the absolute reference so it will be easy to copy later!
2 points
QUESTION 17
Copy and paste the formula from cell E5 into the rest of column E. (Well, at least from E6 down to E55.) What formula is now in cell E17?

Using the data below, I need answers to the following questions:
a) Using the data in Table 1, specify a linear functional form for the demand for Combination 1 meals, and run a regression to estimate the demand for Combo 1meals.
b) Using statistical software (Excel), estimate the parameters of the empirical demand function specifiedin part a.Write your estimated industry demand equation.
c) Evaluate your regression results by examining signs of parameters, p-values, and the R2.
d) Discuss how the estimation of demand might beimproved.
e) If the owner plans to charge a price of 4.15 for a Combination 1 meal and spend $18,000 per week on advertising, how many Combination 1 meals do you predict will be sold each week?
f) If the owner spends $18,000 per week on advertising, write the equation for the inverse demand function. Then, calculate the demand price for 50,000 Combination meals.
Estimation and Analysis of Demand for Fast Food Meals
You work for PriceWatermanCoopers as a market analyst. PWC has been hired by the owner of two Burger King restaurants located in a suburban Atlanta market area to study the demand for its basic hamburger meal packageâreferred to as âCombination 1" on its menus. The two restaurants face competition in the Atlanta suburb from five other hamburger restaurants (three MacDonaldâs and two Wendyâs restaurants) and three other restaurants serving âdrive-throughâ fast food (a Taco Bell, a Kentucky Fried Chicken, and a small family-owned Chinese restaurant).
The owner of the two Burger King restaurants provides PWC with the data shown in Table 1. Q is the total number of Combination 1 meals sold at both locations during each week in 1998. P is the average price charged for a Combination 1 meal at the two locations. [Prices are identical at the two Burger King locations.] Every week the Burger King owner advertises special price offers at its two restaurants exclusively in daily newspaper advertisements. A is the dollar amount spent on newspaper ads for each week in 1998. The owner could not provide PWC with data on prices charged by other competing restaurants during 1998. For the one-year time period of the study, household income and population in the suburb did not change enough to warrant inclusion in the demand analysis.
TABLE 1: Weekly Sales Data for Combination 1 Meals (1998)
week Q P A week Q P A
| 1 | 51,345 | 2.78 | 4,280 | 27 | 78,953 | 2.27 | 21,225 |
| 2 | 50,337 | 2.35 | 3,875 | 28 | 52,875 | 3.78 | 7,580 |
| 3 | 86,732 | 3.22 | 12,360 | 29 | 81,263 | 3.95 | 4,175 |
| 4 | 118,117 | 1.85 | 19,250 | 30 | 67,260 | 3.52 | 4,365 |
| 5 | 48,024 | 2.65 | 6,450 | 31 | 83,323 | 3.45 | 12,250 |
| 6 | 97,375 | 2.95 | 8,750 | 32 | 68,322 | 3.92 | 11,850 |
| 7 | 75,751 | 2.86 | 9,600 | 33 | 71,925 | 4.05 | 14,360 |
| 8 | 78,797 | 3.35 | 9,600 | 34 | 29,372 | 4.01 | 9,540 |
| 9 | 59,856 | 3.45 | 9,600 | 35 | 21,710 | 3.68 | 7,250 |
| 10 | 23,696 | 3.25 | 6,250 | 36 | 37,833 | 3.62 | 4,280 |
| 11 | 61,385 | 3.21 | 4,780 | 37 | 41,154 | 3.57 | 13,800 |
| 12 | 63,750 | 3.02 | 6,770 | 38 | 50,925 | 3.65 | 15,300 |
| 13 | 60,996 | 3.16 | 6,325 | 39 | 57,657 | 3.89 | 5,250 |
| 14 | 84,276 | 2.95 | 9,655 | 40 | 52,036 | 3.86 | 7,650 |
| 15 | 54,222 | 2.65 | 10,450 | 41 | 58,677 | 3.95 | 6,650 |
| 16 | 58,131 | 3.24 | 9,750 | 42 | 73,902 | 3.91 | 9,850 |
| 17 | 55,398 | 3.55 | 11,500 | 43 | 55,327 | 3.88 | 8,350 |
| 18 | 69,943 | 3.75 | 8,975 | 44 | 16,262 | 4.12 | 10,250 |
| 19 | 79,785 | 3.85 | 8,975 | 45 | 38,348 | 3.94 | 16,450 |
| 20 | 38,892 | 3.76 | 6,755 | 46 | 29,810 | 4.15 | 13,200 |
| 21 | 43,240 | 3.65 | 5,500 | 47 | 69,613 | 4.12 | 14,600 |
| 22 | 52,078 | 3.58 | 4,365 | 48 | 45,822 | 4.16 | 13,250 |
| 23 | 11,321 | 3.78 | 9,525 | 49 | 43,207 | 4.00 | 18,450 |
| 24 | 73,113 | 3.75 | 18,600 | 50 | 81,998 | 3.93 | 16,500 |
| 25 | 79,988 | 3.22 | 14,450 | 51 | 46,756 | 3.89 | 6,500 |
| 26 | 98,311 | 3.42 | 15,500 | 52 | 34,592 | 3.83 | 5,650 |
