OPER1135 Lecture Notes - Lecture 17: Scatter Plot, Box Plot, Homoscedasticity

9 Apr 2015
School
Department
Course
Professor
Document Summary
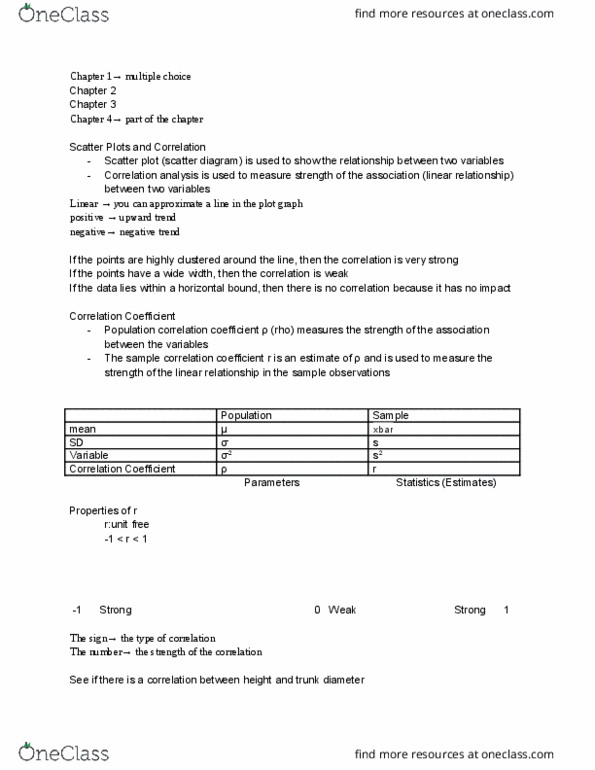
Relationship models: we have looked at the relationship between variables using correlation. Analytically using correlation: with regression, we extend that analysis to describe the relationship and to predict outcomes based on inputs. Features of the coefficient of correlation: the population coefficient of correlation is referred as , the sample coefficient of correlation is referred to as r, either or r have the following features: The closer to 1, the stronger the negative linear relationship. The closer to 1, the stronger the positive linear relationship. The closer to 0, the weaker the linear relationship. Predict the value of a dependent (y) variable based on the value of at least one independent (x) variable. Explain the impact of changes in an independent variable on the dependent variable: variables: Independent variable: the variable(s) used to predict or explain the dependent variable (aka input variable, x-variable, predictor variable, explanatory variable)