CAS MA 115 Lecture Notes - Lecture 8: Simple Random Sample, Standard Deviation, Sampling Distribution

1 May 2018
School
Department
Course
Professor

CHAPTER 8 – SAMPLING DISTRIBUTIONS
Section 8.1 – Distribution of the Sample Mean
Objective 1 – Describe the Distribution of the Sample Mean (for a normal population)
• Statistics such as the sample mean are random variables because their value varies from
sample to sample and each has its own probability distribution
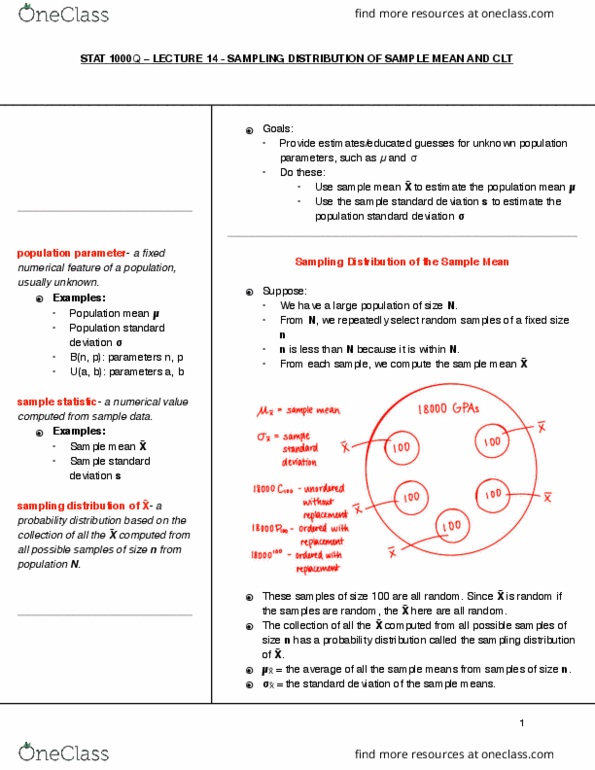
• Sampling Distribution (of a statistic) – a probability distribution for all possible values of
the statistic computed from a sample of size n
• Sampling Distribution (of the sample mean) – a probability distribution of all possible
values of the random variable (sample mean) computed from a sample of size n with a
population with mean μ and standard deviation σ
• Steps:
o 1. Obtain a simple random sample of size n
o 2. Compute the sample mean of this sample
o 3. Repeat steps 1 & 2 until all distinct simple random samples of size n have been
obtained
• ex1: the weights of pennies minted after 1982 are approximately normally distributed
with mean 2.46 grams and standard deviation 0.02 grams. Approximate the sampling
distribution of the sample mean by obtaining 200 simple random samples of size n = 5
from this population.
o The first sample had the following data: 2.433, 2.466, 2.423, 2.442, 2.456 for a
sample mean of 2.444
▪ Now do this for the next 200 samples
o After computing all the sample means the mean of the 200 sample is 2.46 which
is the same as the mean of the population
o The standard deviation of the sample means is 0.0086, which is smaller than the
standard deviation of the population
o The histogram:
▪
• As the sample size increases, the standard deviation of the distribution of the sample
mean decreases and as the sample size decreases, the standard deviation of the
distribution of the sample mean increases
o Essentially, a larger sample size means more certainty while a smaller sample size
means less certainty
find more resources at oneclass.com
find more resources at oneclass.com
Document Summary
Section 8. 1 distribution of the sample mean. Obtain a simple random sample of size n: 2. Compute the sample mean of this sample: 3. Repeat steps 1 & 2 until all distinct simple random samples of size n have been obtained: ex1: the weights of pennies minted after 1982 are approximately normally distributed with mean 2. 46 grams and standard deviation 0. 02 grams. So, n = 20 indicates less variability in the distribution of the sample mean rather than n = 5: ***low variability = low standard deviation. Objective 2 mean & standard deviation of the sampling distribution of the sample mean. Objective 3 describe the distribution of the sample mean (for a normal population) If a random variable x is normally distributed the sampling distribution of x is normally distributed: ex3: the weights of pennies minted after 1982 are approximately normally distributed with mean 2. 46 grams and standard deviation 0. 02 grams.