PSY 370 Lecture Notes - Lecture 26: Stanine, Linear Map, Standard Deviation

Document Summary
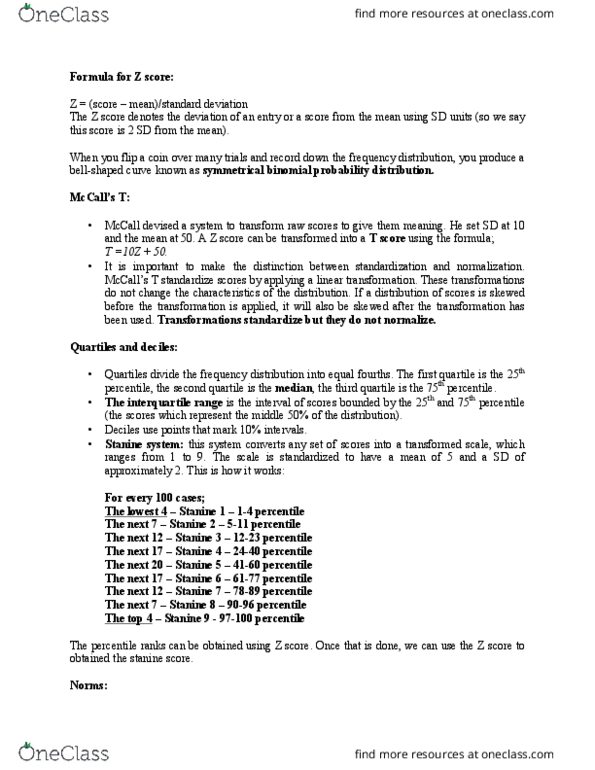
There are lots of ways to combine item scores into test scores. And how we do this determines how we can interpret those scores. Transformations of raw scores so that they have a particular mean and standard deviation. Gives context and makes it easier to interpret a single score. The shape of the distribution stays the same. *this maintains consistency among all scores and does not change the underlying meaning of the distribution. Scores now have a mean of 0 and a standard deviation of 1. You"re just rewriting the scale at the bottom of the bell curve. *whether a z-score is positive or negative is very important! Now, the scores have a mean of 50, sd of 10. ***it is functionally impossible to have a negative t-score. You can transform scores to fit any mean and sd you want this way. Now we are changing the shape of the distribution.