QTM 100 Lecture Notes - Lecture 4: Descriptive Statistics, Dependent And Independent Variables, Quartile

13 Sep 2017
School
Department
Course
Professor
Document Summary
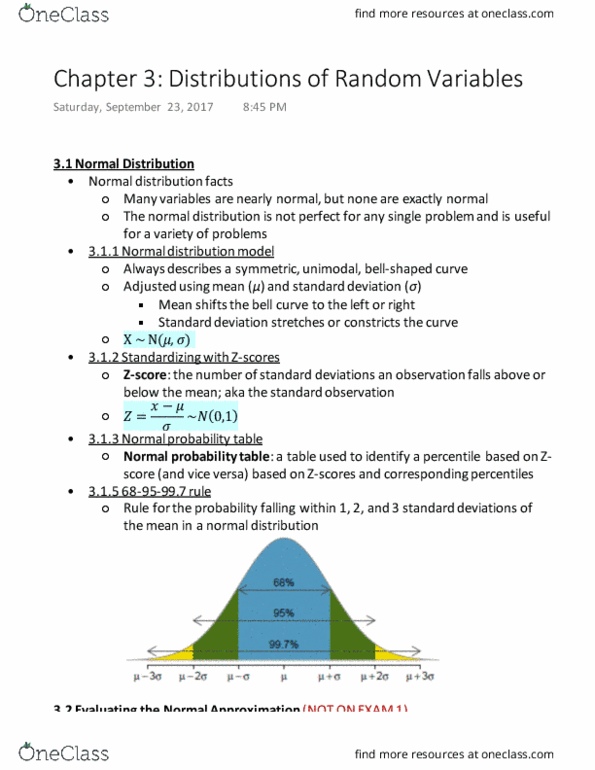
When a distribution is unimodal, approximately symmetric, and bell- shaped, we can apply the empirical rule to make conclusions about the data. Empirical rule: shorthand used to remember the percentage of values that lie within a band around the mean in a normal distribution with 68. 27%, 95. 45% and 99. 73% of the values lie within one, two and three standard deviations of the mean, respectively. 68% of observations fall within 1 sd of the mean (xavg s) 95% of observations fall within 2 sd of the mean (xavg 2s) Nearly all observations fall within 3 sd of the mean (xavg 3s) Based on this rule, we know it is unusual for an observation to fall more than 3 sds away from the mean (for unimodal, symmetric, bell-shaped data. Therefore, one way we can assess if an observation is a potential outlier is to calculate how many standard deviations it is away from the mean.