QTM 100 Lecture Notes - Lecture 22: Analysis Of Variance, Summary Statistics, Dependent And Independent Variables

10 Aug 2016
School
Department
Course
Professor
Document Summary
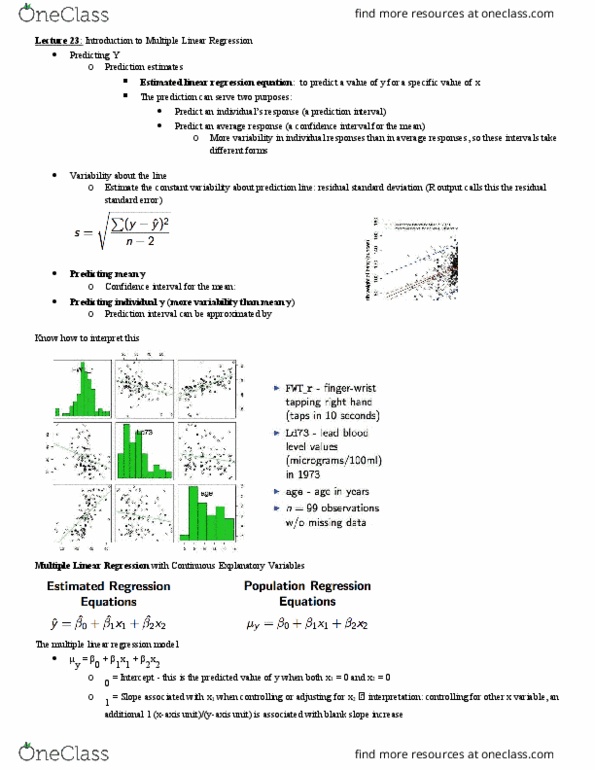
Residual: distance between an observed data point and the fitted line: residual = y . Line of best fit: calculated by minimizing the distance between the observed data values and the line of best fit. Method of least squares (least squares regression line): minimize the residual sum of squares: minimize (residual)2 or (y )2, want sum of zero! 0 p-value: two-tailed probability from t distribution with df = n 2 p-value= 2 pr(t df. Inference for the slope is usually of interest in linear regression: can perform a hypothesis test: h. 0: conclusion: at the 95% confidence level, for each 1 (insert x-axis units) increase in x the rate of y increases by as few as ___ or as many as ___ Inference for the intercept is not always of interest - usually the focus is on the slope: hypothesis test for: h. Can use regression line to predict y-value @ given x-value (plug into regression line formula)