KIN 3502 Lecture Notes - Lecture 3: Randomness, Percentile, Central Tendency

1 Sep 2016
School
Course
Professor
Document Summary
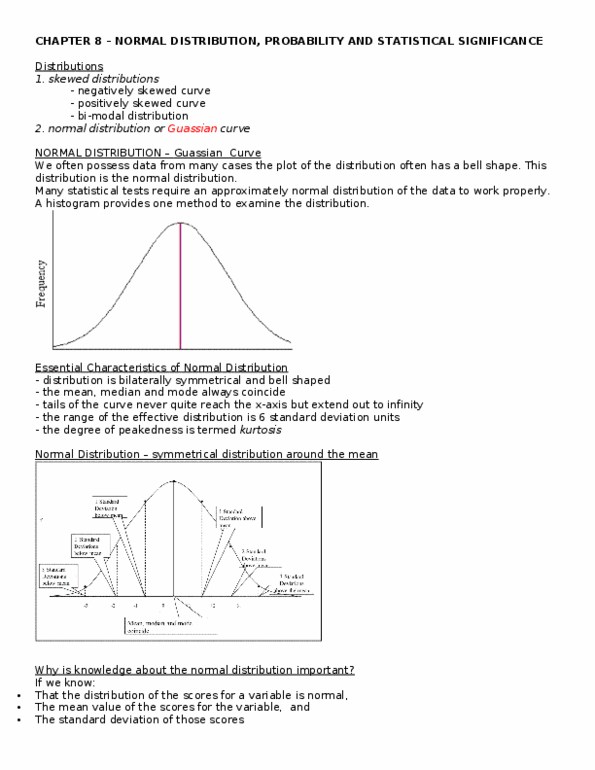
Illustrate types of data and associated measurement scales. Understand measures of central tendency and variability. Describe standard scores and their purpose in measurement. Characterized by: bilaterally symmetrical distribution about the center of the curve, mean, median, mode centered on the curve o farther from the curve. Frequency declines in a predictable manner as scores deviate farther and. Right in the middle of the curve there is a perfect-normal curve. Mean, median, and mode will have the exact same value. Not all symmetrical curves are normal: not all bell shaped curves are considered normal, has to encompass characteristics that lead us to think it is a normal curve. The more you add onto the number generator, the more the values of information will fall into a curve. If you had a limited sample size, you would not have a large enough sample to create a curve. Skewness: 1 to +1 o o.