FIN20150 Lecture Notes - Lecture 2: Tax Rate, Current Liability, Cash Flow
30 views2 pages

Document Summary
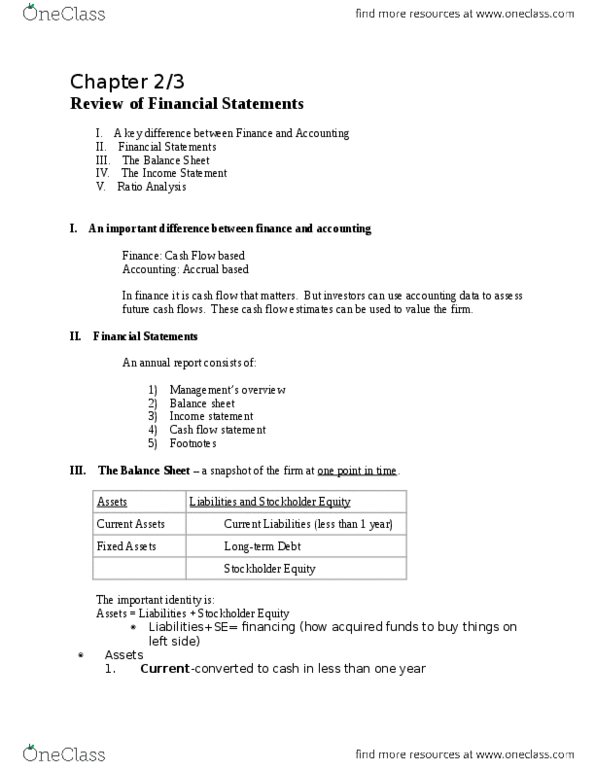
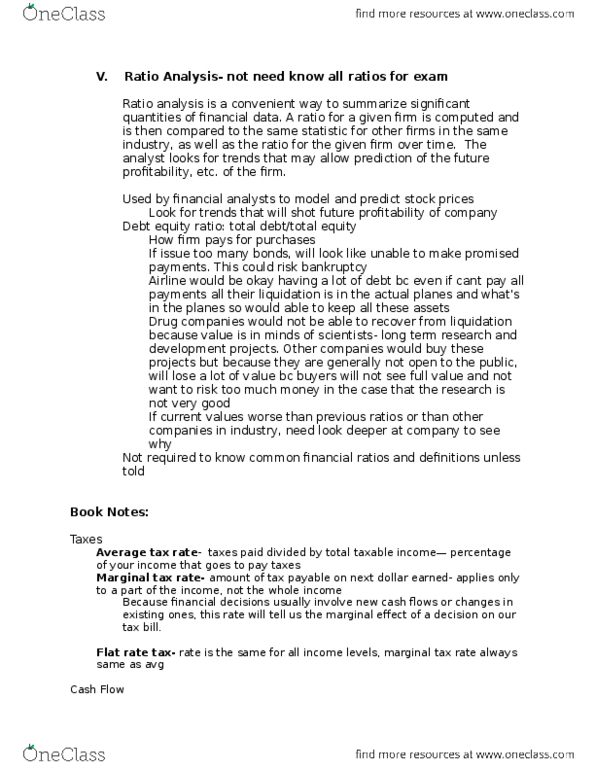
Book: the price that you bought a stock at. The balance sheet: is it a snapshot or picture of a company"s assets and liabilities at a certain point in time. The assets at the top are more liquid than the assets at the bottom. Net working capital = current assets- current liabilities. Cash, account receivable, and inventory are all current assets. Balance sheets will provide the book value of assets, liabilities, and shareholder"s equity. Market value is the price at which these assets, liabilities, and equity can be bought at. Looking at revenues and expenses (try and match if possible) Average rate is just the total of your taxable income divided by the total amount you paid in taxes. Marginal is what tax rate you should be charged if you made more. The marginal tax rate (if above the average) will make the average tax rate go up.
Get access
Grade+20% off
$8 USD/m$10 USD/m
Billed $96 USD annually

Homework Help
Study Guides
Textbook Solutions
Class Notes
Textbook Notes
Booster Class
40 Verified Answers
Class+
$8 USD/m
Billed $96 USD annually

Homework Help
Study Guides
Textbook Solutions
Class Notes
Textbook Notes
Booster Class
30 Verified Answers
Related Documents
Related Questions
| P5-3 Preparing a Balance Sheet and Analyzing Some of Its Parts LO5-3 | |||||||
| Exquisite Jewelers is developing its annual financial statements for 2015. The following amounts were correct at December 31, 2015: | |||||||
| cash, $58,000; accounts receivable, $71,000; merchandise inventory, $154,000; prepaid insurance, $1,500; | |||||||
| investment in stock of Z corporation (long-term), $36,000; store equipment, $67,000; used store equipment held for disposal, $9,000; | |||||||
| accumulated depreciation, store equipment, $19,000; accounts payable, $52,500; long-term note payable, $42,000; income taxes payable, $9,000; | |||||||
| retained earnings, $164,000; and common stock, 100,000 shares outstanding, par value $1.00 per share (originally sold and issued at $1.10 per share). | |||||||
| Required: | |||||||
| 1 | Based on these data, prepare a December 31, 2015, balance sheet. (Amounts to be deducted should be indicated by a minus sign.) | ||||||
| Possible input areas are shaded. | |||||||
| EXQUISITE JEWELERS | |||||||
| Balance Sheet | |||||||
| December 31, 2015 | |||||||
| Assets | |||||||
| Current assets: | |||||||
| Total current assets | $ - | ||||||
| Long-term investments: | |||||||
| Fixed assets: | |||||||
| Total fixed assets | - | ||||||
| Other assets: | |||||||
| Total assets | $ 377,500 | ||||||
| Liabilities | |||||||
| Current liabilities: | |||||||
| Total current liabilities | $ - | ||||||
| Long-term liabilities: | |||||||
| Total liabilities | - | ||||||
| Stockholders' Equity | |||||||
| Contributed capital: | |||||||
| Total contributed capital | - | ||||||
| Total stockholders' equity | - | ||||||
| Total liabilities and stockholders' equity | $ - | ||||||
| Required: | |||||||
| 2 | What is the net book value of the store equipment? | ||||||
| Net book value | |||||||

| Joshua & White Technologies: December 31 Balance Sheets | ||||||
| (Thousands of Dollars) | ||||||
| Assets | 2010 | 2009 | ||||
| Cash and cash equivalents | $21,000 | $20,000 | ||||
| Short-term investments | 3,759 | 3,240 | ||||
| Accounts Receivable | 52,500 | 48,000 | ||||
| Inventories | 84,000 | 56,000 | ||||
| Total current assets | $161,259 | $127,240 | ||||
| Net fixed assets | 218,400 | 200,000 | ||||
| Total assets | $379,659 | $327,240 | ||||
| Liabilities and equity | ||||||
| Accounts payable | $33,600 | $32,000 | ||||
| Accruals | 12,600 | 12,000 | ||||
| Notes payable | 19,929 | 6,480 | ||||
| Total current liabilities | $66,129 | $50,480 | ||||
| Long-term debt | 67,662 | 58,320 | ||||
| Total liabilities | $133,791 | $108,800 | ||||
| Common stock | 183,793 | 178,440 | ||||
| Retained Earnings | 62,075 | 40,000 | ||||
| Total common equity | $245,868 | $218,440 | ||||
| Total liabilities and equity | $379,659 | $327,240 | ||||
| Joshua & White Technologies December 31 Income Statements | ||||||
| (Thousands of Dollars) | ||||||
| 2010 | 2009 | |||||
| Sales | $420,000 | $400,000 | ||||
| Expenses excluding depr. and amort. | 327,600 | 320,000 | ||||
| EBITDA | $92,400 | $80,000 | ||||
| Depreciation and Amortization | 19,660 | 18,000 | ||||
| EBIT | $72,740 | $62,000 | ||||
| Interest Expense | 5,740 | 4,460 | ||||
| EBT | $67,000 | $57,540 | ||||
| Taxes (40%) | 26,800 | 23,016 | ||||
| Net Income | $40,200 | $34,524 | ||||
| Common dividends | $18,125 | $17,262 | ||||
| Addition to retained earnings | $22,075 | $17,262 | ||||
| Other Data | 2010 | 2009 | ||||
| Year-end Stock Price | $90.00 | $96.00 | ||||
| # of shares (Thousands) | 4,052 | 4,000 | ||||
| Lease payment (Thousands of Dollars) | $20,000 | $20,000 | ||||
| Sinking fund payment (Thousands of Dollars) | $0 | $0 | ||||
| Ratio Analysis | 2010 | 2009 | Industry Avg | |||
| Liquidity Ratios | ||||||
| Current Ratio | 2.38 | 2.52 | 2.58 | |||
| Quick Ratio | 1.17 | 1.41 | 1.53 | |||
| Asset Management Ratios | ||||||
| Inventory Turnover | 1.11 | 1.22 | 7.69 | |||
| Days Sales Outstanding | 45.63 | 43.80 | 47.45 | |||
| Fixed Assets Turnover | 1.92 | 2.00 | 2.04 | |||
| Total Assets Turnover | 3.81 | 5.64 | 1.23 | |||
| Debt Management Ratios | ||||||
| Debt Ratio | 32.1% | |||||
| Times-interest-earned ratio | 15.33 | |||||
| EBITDA coverage ratio | 4.18 | |||||
| Profitability Ratios | ||||||
| Profit Margin | 9.57% | 8.63% | 8.86% | |||
| Basic Earning Power | 19.16% | 18.95% | 19.48% | |||
| Return on Assets | 10.59% | 10.55% | 10.93% | |||
| Return on Equity | 21.87% | 19.35% | 16.10% | |||
| Market Value Ratios | ||||||
| Earnings per share | NA | |||||
| Price-to-earnings ratio | 10.65 | |||||
| Cash flow per share | NA | |||||
| Price-to-cash flow ratio | 7.11 | |||||
| Book Value per share | NA | |||||
| Market-to-book ratio | 1.72 | |||||
| a. Has Joshua & White's liquidity position improved or worsened? Explain. | ||||||
| The position of JW has worsend because there ration has fallen from 1.41 to 1.17 | ||||||
| b. Has Joshua & White's ability to manage its assets improved or worsened? Explain. | ||||||
| c. How has Joshua & White's profitability changed during the last year? | ||||||
| d. Perform an extended Du Pont analysis for Joshua & White for 2008 and 2009. | ||||||
| ROE = | PM x | TA Turnover x Equity Multiplier | ||||
| 2010 | ||||||
| 2009 | ||||||
| e. Perform a common size analysis. What has happened to the composition | ||||||
| (that is, percentage in each category) of assets and liabilities? | ||||||
| Common Size Balance Sheets | ||||||
| Assets | 2010 | 2009 | ||||
| Cash and cash equivalents | ||||||
| Short-term investments | ||||||
| Accounts Receivable | ||||||
| Inventories | ||||||
| Total current assets | ||||||
| Net fixed assets | ||||||
| Total assets | ||||||
| Liabilities and equity | 2010 | 2009 | ||||
| Accounts payable | ||||||
| Accruals | ||||||
| Notes payable | ||||||
| Total current liabilities | ||||||
| Long-term debt | ||||||
| Total liabilities | ||||||
| Common stock | ||||||
| Retained Earnings | ||||||
| Total common equity | ||||||
| Total liabilities and equity | ||||||
| Common Size Income Statements | 2010 | 2009 | ||||
| Sales | ||||||
| Expenses excluding depr. and amort. | ||||||
| EBITDA | ||||||
| Depreciation and Amortization | ||||||
| EBIT | ||||||
| Interest Expense | ||||||
| EBT | ||||||
| Taxes (40%) | ||||||
| Net Income | ||||||
| f. Perform a percent change analysis. What does this tell you about the change in profitability | ||||||
| and asset utilization? | ||||||
| Percent Change Balance Sheets | Base | |||||
| Assets | 2010 | 2009 | ||||
| Cash and cash equivalents | ||||||
| Short-term investments | ||||||
| Accounts Receivable | ||||||
| Inventories | ||||||
| Total current assets | ||||||
| Net fixed assets | ||||||
| Total assets | ||||||
| Base | ||||||
| Liabilities and equity | 2010 | 2009 | ||||
| Accounts payable | ||||||
| Accruals | ||||||
| Notes payable | ||||||
| Total current liabilities | ||||||
| Long-term debt | ||||||
| Total liabilities | ||||||
| Common stock | ||||||
| Retained Earnings | ||||||
| Total common equity | ||||||
| Total liabilities and equity | ||||||
| Base | ||||||
| Percent Change Income Statements | 2010 | 2009 | ||||
| Sales | ||||||
| Expenses excluding depr. and amort. | ||||||
| EBITDA | ||||||
| Depreciation and Amortization | ||||||
| EBIT | ||||||
| Interest Expense | ||||||
| EBT | ||||||
| Taxes (40%) | ||||||
| Net Income | ||||||