FINC-220 Lecture Notes - Lecture 10: Economic Equilibrium, Expected Return, Capital Asset Pricing Model


Chapter 13
Return, risk and the security market line
Chapter outline
• Expected Returns and Variances
• Portfolios
• Announcements, Surprises, and Expected Returns
• Risk: Systematic and Unsystematic
• Diversification and Portfolio Risk
• Systematic Risk and Beta
• The Security Market Line
• The SML and the Cost of Capital: A Preview
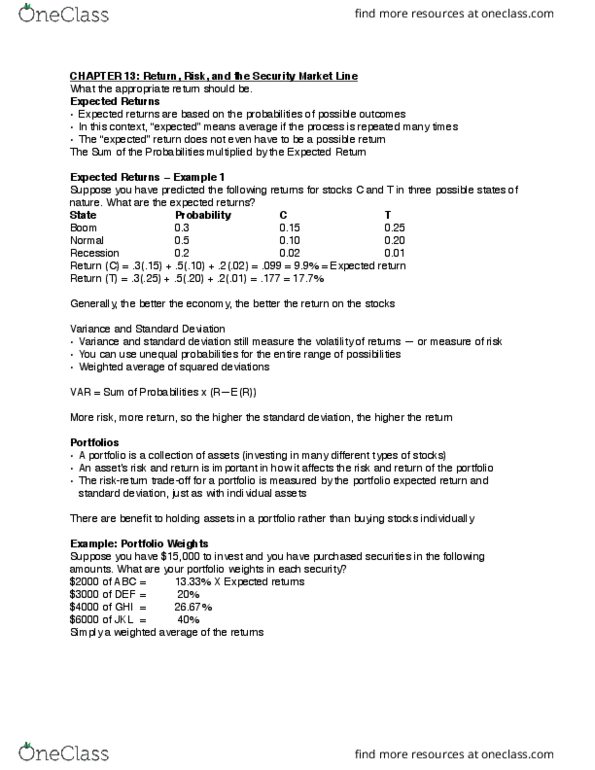
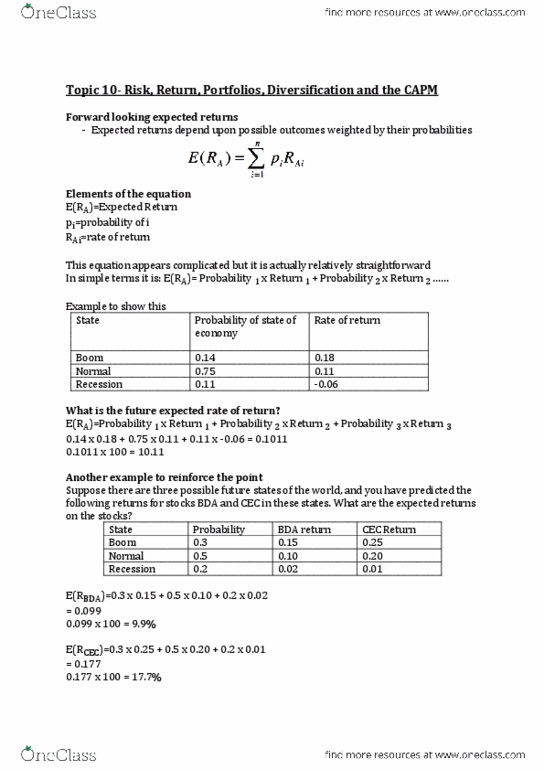
Expected returns
• Expected returns are based on the probabilities of possible outcomes
å
n
i
ii RpRE
1
)(
find more resources at oneclass.com
find more resources at oneclass.com

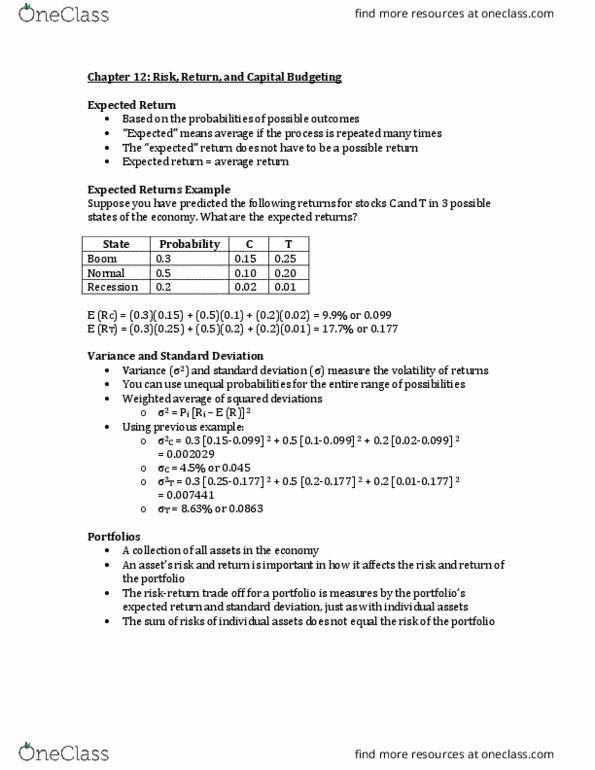
Example: expected returns
• Suppose you have predicted the following returns for stocks C and T in three possible
states of the economy.
What are the expected returns?
State Probability C T
Boom 0.3 15 25
Normal 0.5 10 20
Recession 0.2 2 1
RC = (15*0.3) + (10*0.5) + (2*0.2) = 9.9%
RT = (25*0.3) + (20*0.5) + (1*0.2) = 17.7%
• The three states of the economy still apply to stocks C and T.
• If the risk-free rate (from chapter 12) is 4.15%, what is the risk premium for C & T?
o RC = 9.9%
o RT =17.7%
o Stock C’s risk premium = 5.75%
o Stock T’s risk premium = 13.55%
Variance and standard deviation
• Variance and standard deviation measure the volatility of returns
• Weighted average of squared deviations
å
=
-=
n
i
ii
RERp
1
22
))((σ
Example: variance and standard deviation
What is the variance and standard deviation for C? for T?
State Probability C T
Boom 0.3 15 25
Normal 0.5 10 20
Recession 0.2 2 1
Expected return 9.9% 17.7%
Stock C
2 = .3(15-9.9)2 + .5(10-9.9) 2 + .2(2-9.9) 2 = 20.29
= 4.50%
Stock T
2 = 74.41; = 8.63%
find more resources at oneclass.com
find more resources at oneclass.com

Practice example
Consider the following information:
State Probability ABC, Inc. (%)
Boom .25 15
Normal .50 8
Slowdown .15 4
Recession .10 - 3
What is the expected return, variance and standard deviation?
E(R) = 8.05%
Variance = σ2= 26.7475
σ = √ 26.7475 = 5.17%
Portfolios
• A portfolio is a collection of assets
• An asset’s risk and return are important in how they affect the risk and return of the
portfolio
Example: portfolio weight
Suppose you have $15,000 to invest and you have purchased securities in the following amounts:
What are your portfolio weights in each security?
.133, .200, .267, .400
Portfolio expected return and variance
• Compute the portfolio return for each state:
RP = w1R1 + w2R2 + … + wmRm
• Compute the expected portfolio return, the variance, and the standard deviation using the
same formula as for an individual asset
Example: portfolio variance
Consider the following information:
State Probability A B
Boom .4 30% -5%
Bust .6 -10% 25%
• What is the expected return for asset A?
o Asset A: E(RA) = .4(30) + .6(-10) = 6%
• What is the variance for asset A?
o Variance(A) = .4(30-6)2 + .6(-10-6)2 = 384
• What is the standard deviation for asset A?
o Std. Dev.(A) = 19.6%
Consider the following information:
State Probability A B
Boom .4 30% -5%
Bust .6 -10% 25%
• What is the expected return for asset B?
o Asset B: E(RB) = 13%
find more resources at oneclass.com
find more resources at oneclass.com
Document Summary
Chapter outline: expected returns and variances, portfolios, announcements, surprises, and expected returns, risk: systematic and unsystematic, diversification and portfolio risk, systematic risk and beta, the security market line, the sml and the cost of capital: a preview. Expected returns: expected returns are based on the probabilities of possible outcomes n. Example: expected returns: suppose you have predicted the following returns for stocks c and t in three possible. Rc = (15*0. 3) + (10*0. 5) + (2*0. 2) = 9. 9% Rt = (25*0. 3) + (20*0. 5) + (1*0. 2) = 17. 7% 1: the three states of the economy still apply to stocks c and t. If the risk-free rate (from chapter 12) is 4. 15%, what is the risk premium for c & t: rc = 9. 9, rt =17. 7, stock c"s risk premium = 5. 75, stock t"s risk premium = 13. 55% Variance and standard deviation: variance and standard deviation measure the volatility of returns, weighted average of squared deviations.