STAT 201 Lecture Notes - Lecture 12: Quartile, Box Plot

4 Apr 2017
School
Department
Course
Professor
Document Summary
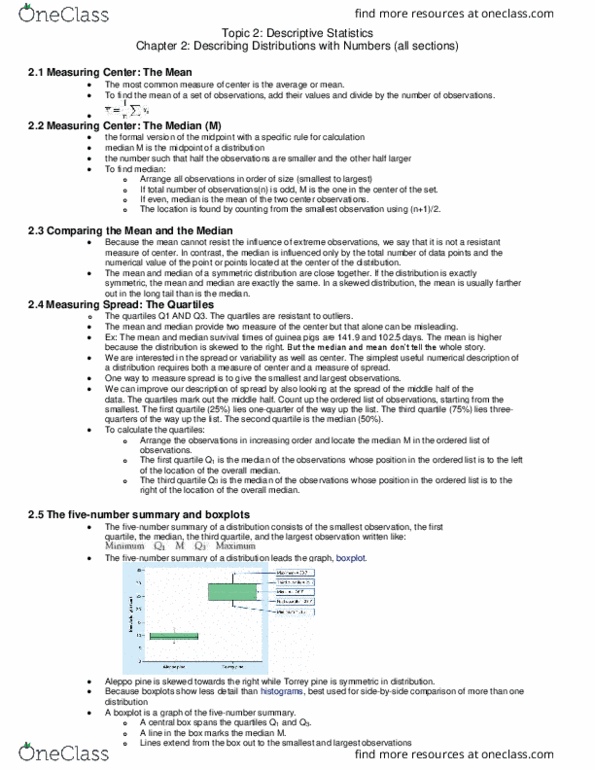
Box plots: median, represents midpoint of data, how to find median b. i. b. ii. b. iii. Arrange all observations in order of size, smallest to largest. If there are an odd # of observations, it is (n+1)/2. If there are an even # of observations, it is the average of the two in the center: first and third quartiles, they are the midpoints of each half, how to calculate b. i. b. ii. b. iii. b. iv. Arrange observations in order of size, smallest to largest. First quartile is the midpoint of the left half of the overall median. Third quartile is the midpoint of the right half of the overall median: overall median is not included in these numbers, five-number summary (represented with a boxplot) d. i. First and third quartile: example of a boxplot, minimum = 4, first quartile = 6, median = 9, third quartile = 12. 5, maximum = 21.