SBS 200 Lecture Notes - Lecture 2: Raw Score, Standard Deviation, Statistic

1 Nov 2018
School
Department
Course
Professor
Document Summary
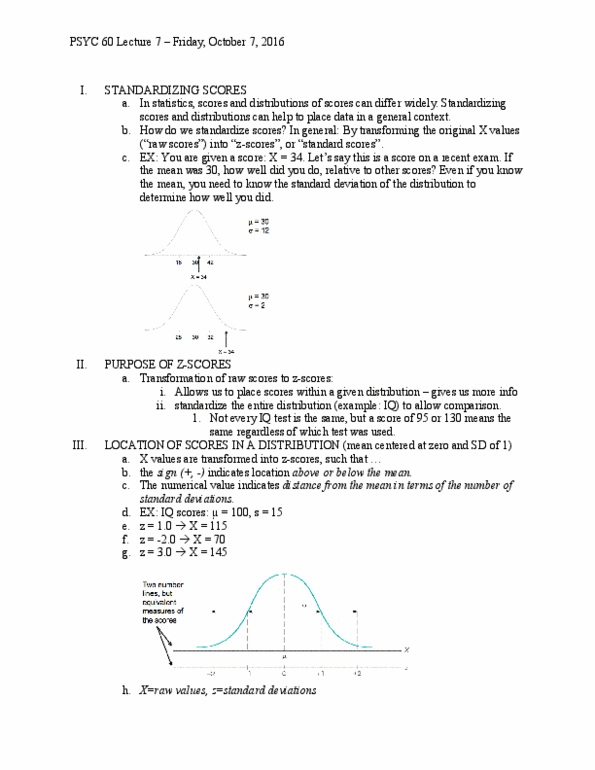
Graphs should have two bars that compare two means (cid:862)(cid:449)ho is taller (cid:373)e(cid:374) or (cid:449)o(cid:373)e(cid:374)? (cid:863) (cid:862)are people (cid:449)ith (cid:272)urly hair or straight hair (cid:373)ore (cid:858)datea(cid:271)le(cid:859)? (cid:863) If we go up one standard deviation: z-score = +1. 0 & raw score = 105. If we go down one standard deviation: z-score = -1. 0 & raw score = 95. If we go up two standard deviations: z-score = +2. 0 & raw score = 110. If we go down two standard deviations: z-score = -2. 0 & raw score = 90. If we go up three standard deviations: z-score = +3. 0 & raw score = 115. If we go down three standard deviations: z-score = -3. 0 & raw score = 85. A score that indicates how many standard deviations an observation is above or below the mean of the distribution. (cid:2201)(cid:2185)(cid:2197)(cid:2200)(cid:2187)= (cid:2200)(cid:2205) (cid:2201)(cid:2185)(cid:2197)(cid:2200)(cid:2187) (cid:2195)(cid:2187)(cid:2196) (cid:2201)(cid:2202)(cid:2196)(cid:2186)(cid:2200)(cid:2186) (cid:2186)(cid:2187)(cid:2204)(cid:2202)(cid:2197)(cid:2196) If score is within 2 standard deviations (z<2: not unusual score.