STAT 1000Q Lecture Notes - Lecture 3: Sample Size Determination, Skewness, Bar Chart

29 Mar 2017
School
Department
Course
Professor


73
STAT 1000Q Full Course Notes
Verified Note
73 documents
Document Summary
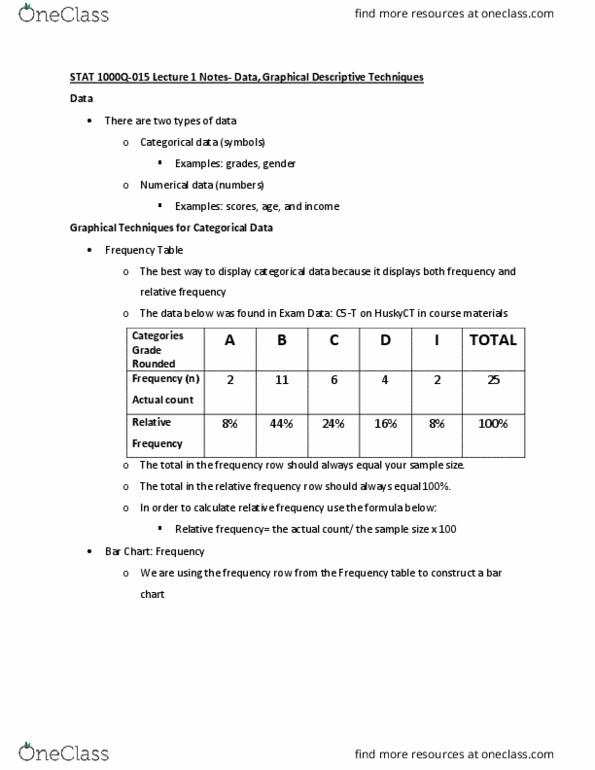
Data: there are two types of data: categorical data (symbols: grades, gender, numerical data (numbers: scores, age, income) Graphical descriptive techniques for categorical data: frequency table (the best way to describe categorical data, bar chart (two different bar charts; frequency or relative frequency, pie chart. Relative frequency = actual count x 100% sample size. Sample size (n) = total number of observations. To compare two different class sizes you would need to construct two different charts. Graphical descriptive techniques for numerical data: histogram (two different histogram; frequency or relative frequency, stem and leaf display. Make sure your histogram adds up to the total number of observations. Range = largest observation - smallest observation. If range ends in a decimal it is okay to make the range a bit bigger, but never smaller. Class frequency = # of observations in the class. Class relative frequency = class frequency sample size (n)