ECON251 Lecture Notes - Lecture 3: Demand Curve, Inferior Good, Perfect Competition

22 Feb 2017
School
Department
Course
Professor

Chapter 3: Where prices come from: the interaction of demand and supply
★Modeling a market
○To analyze a market (e.g. market for oranges), we need a model how buyers and sellers behave
○We assume perfectly competitive market, which is a market with
■Many buyers many sellers
■All firms selling identical products
■No barriers to new firms to enter the market
★The Demand side of the market
○How do buyers behave?
■Demand schedule: a table that shows the relationship between the price of a product and the quantity of the product
demanded
■Demand curve: A curve that shows the relationship between the price of a product and the quantity of the product
demanded
★The Law of Demand
○Quantity demanded: (Q^D) The amount of a good or service that a consumer is willing and able to buy at a given price
○Market demand: is the demand by all the consumers of a given good/service
○Law of demand: as P goes up, (Q^D) goes down and vice versa
■
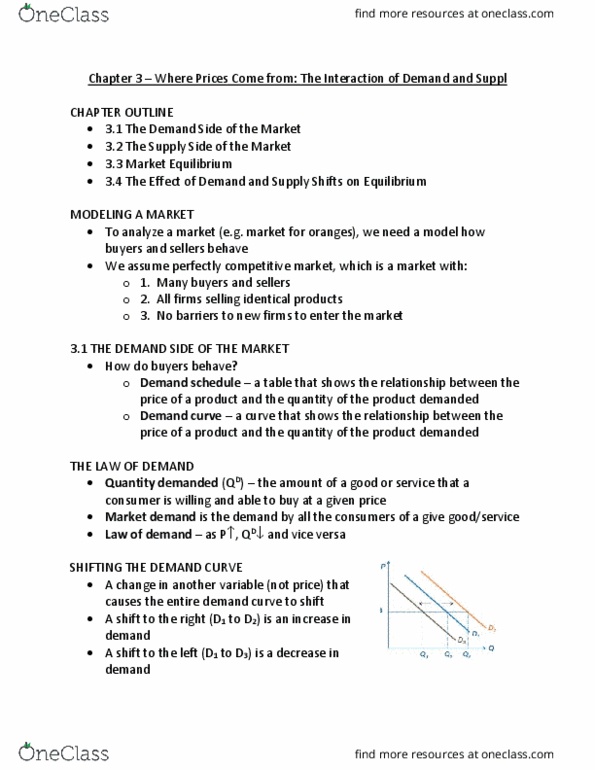
★Shifting the Demand Curve
○A change in another variable (not price) that affects demand, causes the entire demand curve to shift
○A shift to the right (D1 to D2) is an increase in demand
○A shift to the left (D1 to D3) is a decrease in demand
○
★Factors that influence demand
○Income
■As demand increases, demand increases (Normal good)
■As income increases, demand decreases (Inferior good)
find more resources at oneclass.com
find more resources at oneclass.com
Document Summary
Chapter 3: where prices come from: the interaction of demand and supply. To analyze a market (e. g. market for oranges), we need a model how buyers and sellers behave. We assume perfectly competitive market, which is a market with. No barriers to new firms to enter the market. Demand schedule: a table that shows the relationship between the price of a product and the quantity of the product demanded. Demand curve: a curve that shows the relationship between the price of a product and the quantity of the product demanded. Quantity demanded: (q^d) the amount of a good or service that a consumer is willing and able to buy at a given price. Market demand: is the demand by all the consumers of a given good/service. Law of demand: as p goes up, (q^d) goes down and vice versa. A change in another variable (not price) that affects demand, causes the entire demand curve to shift.