ECO 304L Lecture Notes - Lecture 4: Demand Curve, 2 On


3. Individual and market demand
Suppose that Kevin and Maria are the only consumers of ice cream cones in
a particular market. The following table shows their monthly demand
schedules:
Price
Kevin’s Quantity
Demanded
Maria’s Quantity
Demanded
(Dollars per
cone)
(Cones)
(Cones)
1
8
12
2
6
8
3
4
6
4
2
4
5
0
2
On the following graph, plot Kevin’s demand for ice cream cones using the
green points (triangle symbol). Next, plot Maria’s demand for ice cream
cones using the purple points (diamond symbol). Finally, plot the market
demand for ice cream cones using the blue points (circle symbol). Line
segments will automatically connect the points. Remember to plot from left
to right.
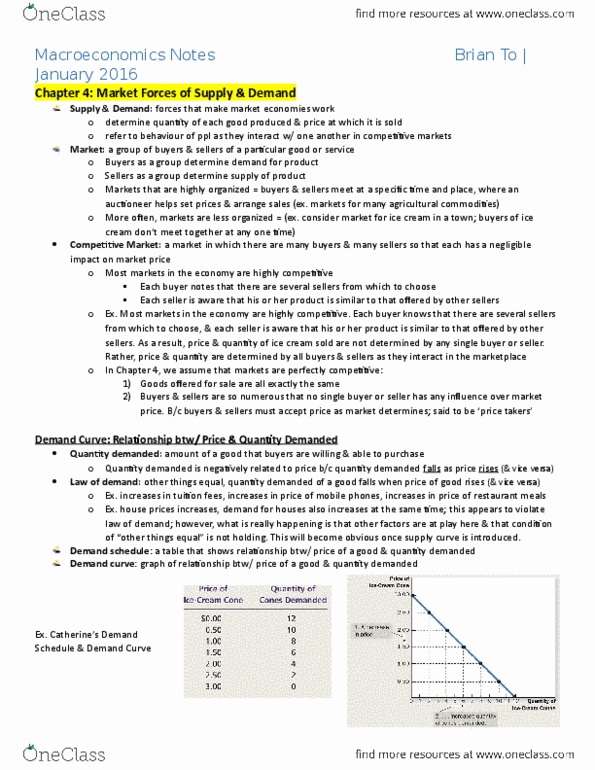
Each point on an individual’s demand curve corresponds to one of the entries
in the individual’s demand schedule. For example, when the price of ice
cream is $1, Kevin demands 8 cones per month and Maria demands 12
cones per month. Therefore, the point (8, 1) lies on Kevin’s demand curve,
and the point (12, 1) lies on Maria’s demand curve.
You can find the points of the market demand curve by adding up the
quantity demanded by each individual in the market. For example, when the
find more resources at oneclass.com
find more resources at oneclass.com
Document Summary
Suppose that kevin and maria are the only consumers of ice cream cones in a particular market. The following table shows their monthly demand schedules: On the following graph, plot kevin"s demand for ice cream cones using the green points (triangle symbol). 2 cones using the purple points (diamond symbol). Finally, plot the market demand for ice cream cones using the blue points (circle symbol). Each point on an individual"s demand curve corresponds to one of the entries in the individual"s demand schedule. For example, when the price of ice cream is , kevin demands 8 cones per month and maria demands 12 cones per month. Therefore, the point (8, 1) lies on kevin"s demand curve, and the point (12, 1) lies on maria"s demand curve. You can find the points of the market demand curve by adding up the quantity demanded by each individual in the market.