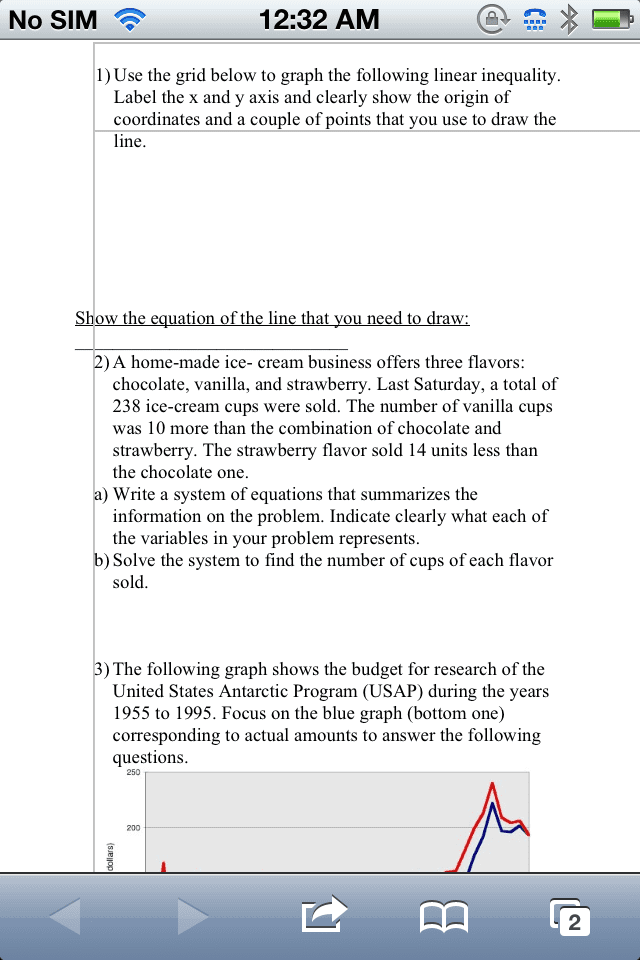
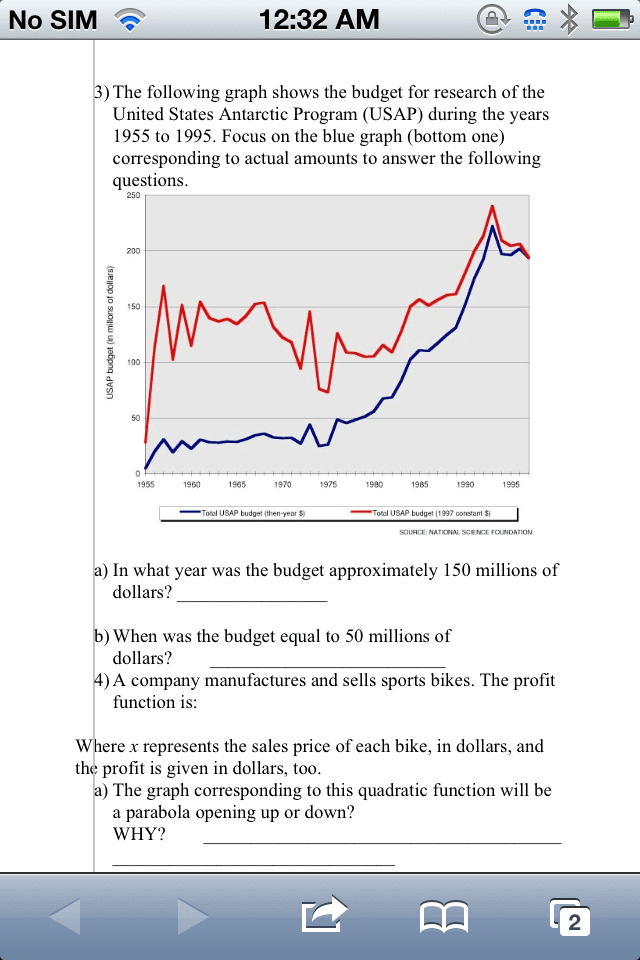
12:32 AM No SIM l)Use the grid below to graph the following linear inequality. Label the x and y axis and clearly show the origin of coordinates and a couple of points that you use to draw the line Show the equation of the line that you need to draw 2) A home-made ice cream business offers three flavors chocolate, vanilla, and strawberry. Last Saturday, a total of 238 ice-cream cups were sold. The number of vanilla cups was 10 more than the combination of chocolate and strawberry. The strawberry flavor sold 14 units less than the chocolate one. a) Write a system of equations that summarizes the information on the problem. Indicate clearly what each of the variables in your problem represents. b) Solve the system to find the number of cups of each flavor sold 3) The following graph shows the budget for research of the United States Antarctic Program (USAP) during the years 1955 to 1995. Focus on the blue graph (bottom one) corresponding to actual amounts to answer the following questions. 250 Ca
Show transcribed image text12:32 AM No SIM l)Use the grid below to graph the following linear inequality. Label the x and y axis and clearly show the origin of coordinates and a couple of points that you use to draw the line Show the equation of the line that you need to draw 2) A home-made ice cream business offers three flavors chocolate, vanilla, and strawberry. Last Saturday, a total of 238 ice-cream cups were sold. The number of vanilla cups was 10 more than the combination of chocolate and strawberry. The strawberry flavor sold 14 units less than the chocolate one. a) Write a system of equations that summarizes the information on the problem. Indicate clearly what each of the variables in your problem represents. b) Solve the system to find the number of cups of each flavor sold 3) The following graph shows the budget for research of the United States Antarctic Program (USAP) during the years 1955 to 1995. Focus on the blue graph (bottom one) corresponding to actual amounts to answer the following questions. 250 Ca