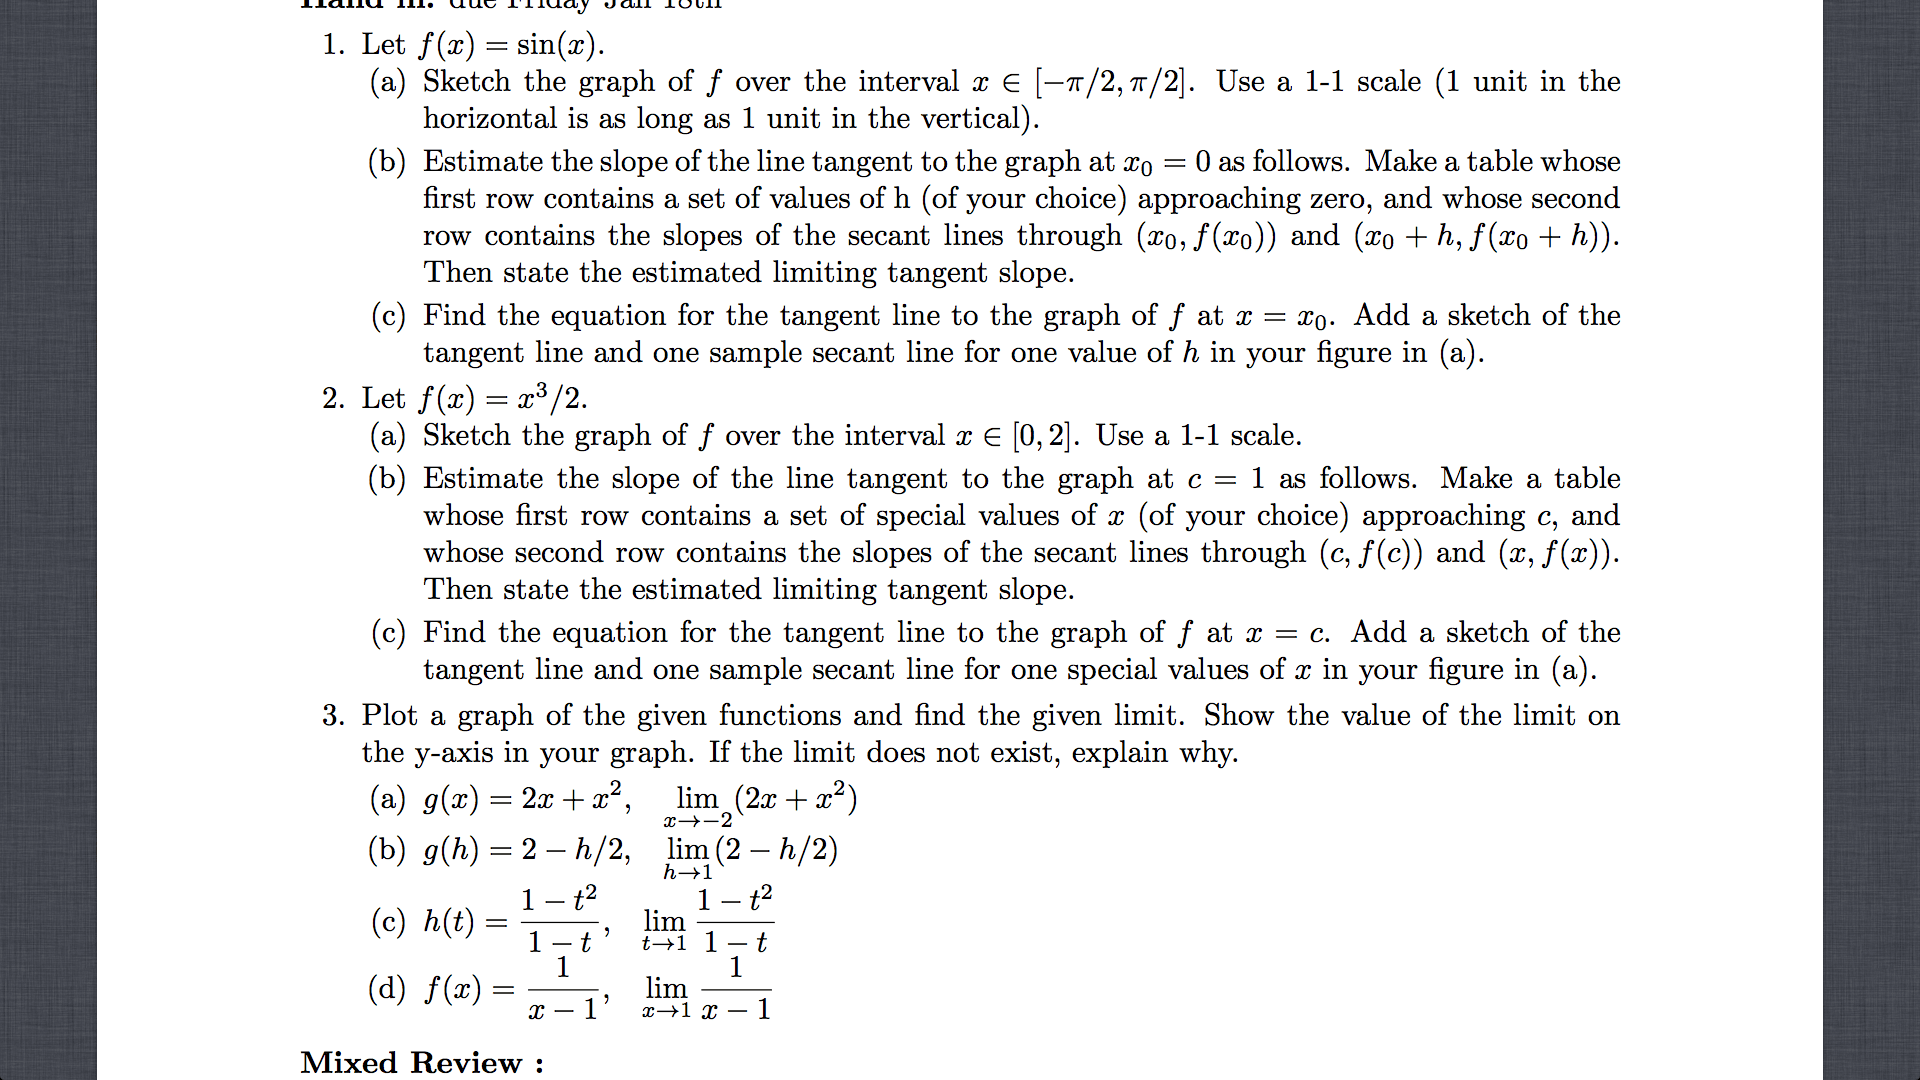
Let f(x) = sin(a). Sketch the graph of f over the interval x epsilon [-pi/2, pi/2]. Use a 1-1 scale (1 unit in the horizontal is as long as 1 unit in the vertical). Estimate the slope of the line tangent to the graph at x0 = 0 as follows. Make a table whose first row contains a set of values of h (of your choice) approaching zero, and whose second row contains the slopes of the secant lines through (x0, f(x0)) and (x0 + h, f(x0 + h)). Then state the estimated limiting tangent slope. Find the equation for the tangent line to the graph of f at x = x0. Add a sketch of the tangent line and one sample secant line for one value of h in your figure in (a). Let f(x) = x3/2. Sketch the graph of f over the interval x epsilon [0, 2]. Use a 1-1 scale. Estimate the slope of the line tangent to the graph at c = 1 as follows. Make a table whose first row contains a set of special values of x (of your choice) approaching c, and whose second row contains the slopes of the secant lines through (c, f(c)) and (x, f(x)). Then state the estimated limiting tangent slope. Find the equation for the tangent line to the graph of f at x = c. Add a sketch of the tangent line and one sample secant line for one special values of x in your figure in (a). Plot a graph of the given functions and find the given limit. Show the value of the limit on the y-axis in your graph. If the limit does not exist, explain why. g(x) = 2x + x2, lim x rightarrow -2 (2x + x2) g(h) = 2 - h/2, lim x rightarrow 1 (2 - h/2) h(t) = 1 - t2 / 1 - t, lim t rightarrow 1 1 - t2 / 1 - t f(x) - 1 / x - 1, lim x rightarrow 1 1 / x - 1
Show transcribed image textLet f(x) = sin(a). Sketch the graph of f over the interval x epsilon [-pi/2, pi/2]. Use a 1-1 scale (1 unit in the horizontal is as long as 1 unit in the vertical). Estimate the slope of the line tangent to the graph at x0 = 0 as follows. Make a table whose first row contains a set of values of h (of your choice) approaching zero, and whose second row contains the slopes of the secant lines through (x0, f(x0)) and (x0 + h, f(x0 + h)). Then state the estimated limiting tangent slope. Find the equation for the tangent line to the graph of f at x = x0. Add a sketch of the tangent line and one sample secant line for one value of h in your figure in (a). Let f(x) = x3/2. Sketch the graph of f over the interval x epsilon [0, 2]. Use a 1-1 scale. Estimate the slope of the line tangent to the graph at c = 1 as follows. Make a table whose first row contains a set of special values of x (of your choice) approaching c, and whose second row contains the slopes of the secant lines through (c, f(c)) and (x, f(x)). Then state the estimated limiting tangent slope. Find the equation for the tangent line to the graph of f at x = c. Add a sketch of the tangent line and one sample secant line for one special values of x in your figure in (a). Plot a graph of the given functions and find the given limit. Show the value of the limit on the y-axis in your graph. If the limit does not exist, explain why. g(x) = 2x + x2, lim x rightarrow -2 (2x + x2) g(h) = 2 - h/2, lim x rightarrow 1 (2 - h/2) h(t) = 1 - t2 / 1 - t, lim t rightarrow 1 1 - t2 / 1 - t f(x) - 1 / x - 1, lim x rightarrow 1 1 / x - 1