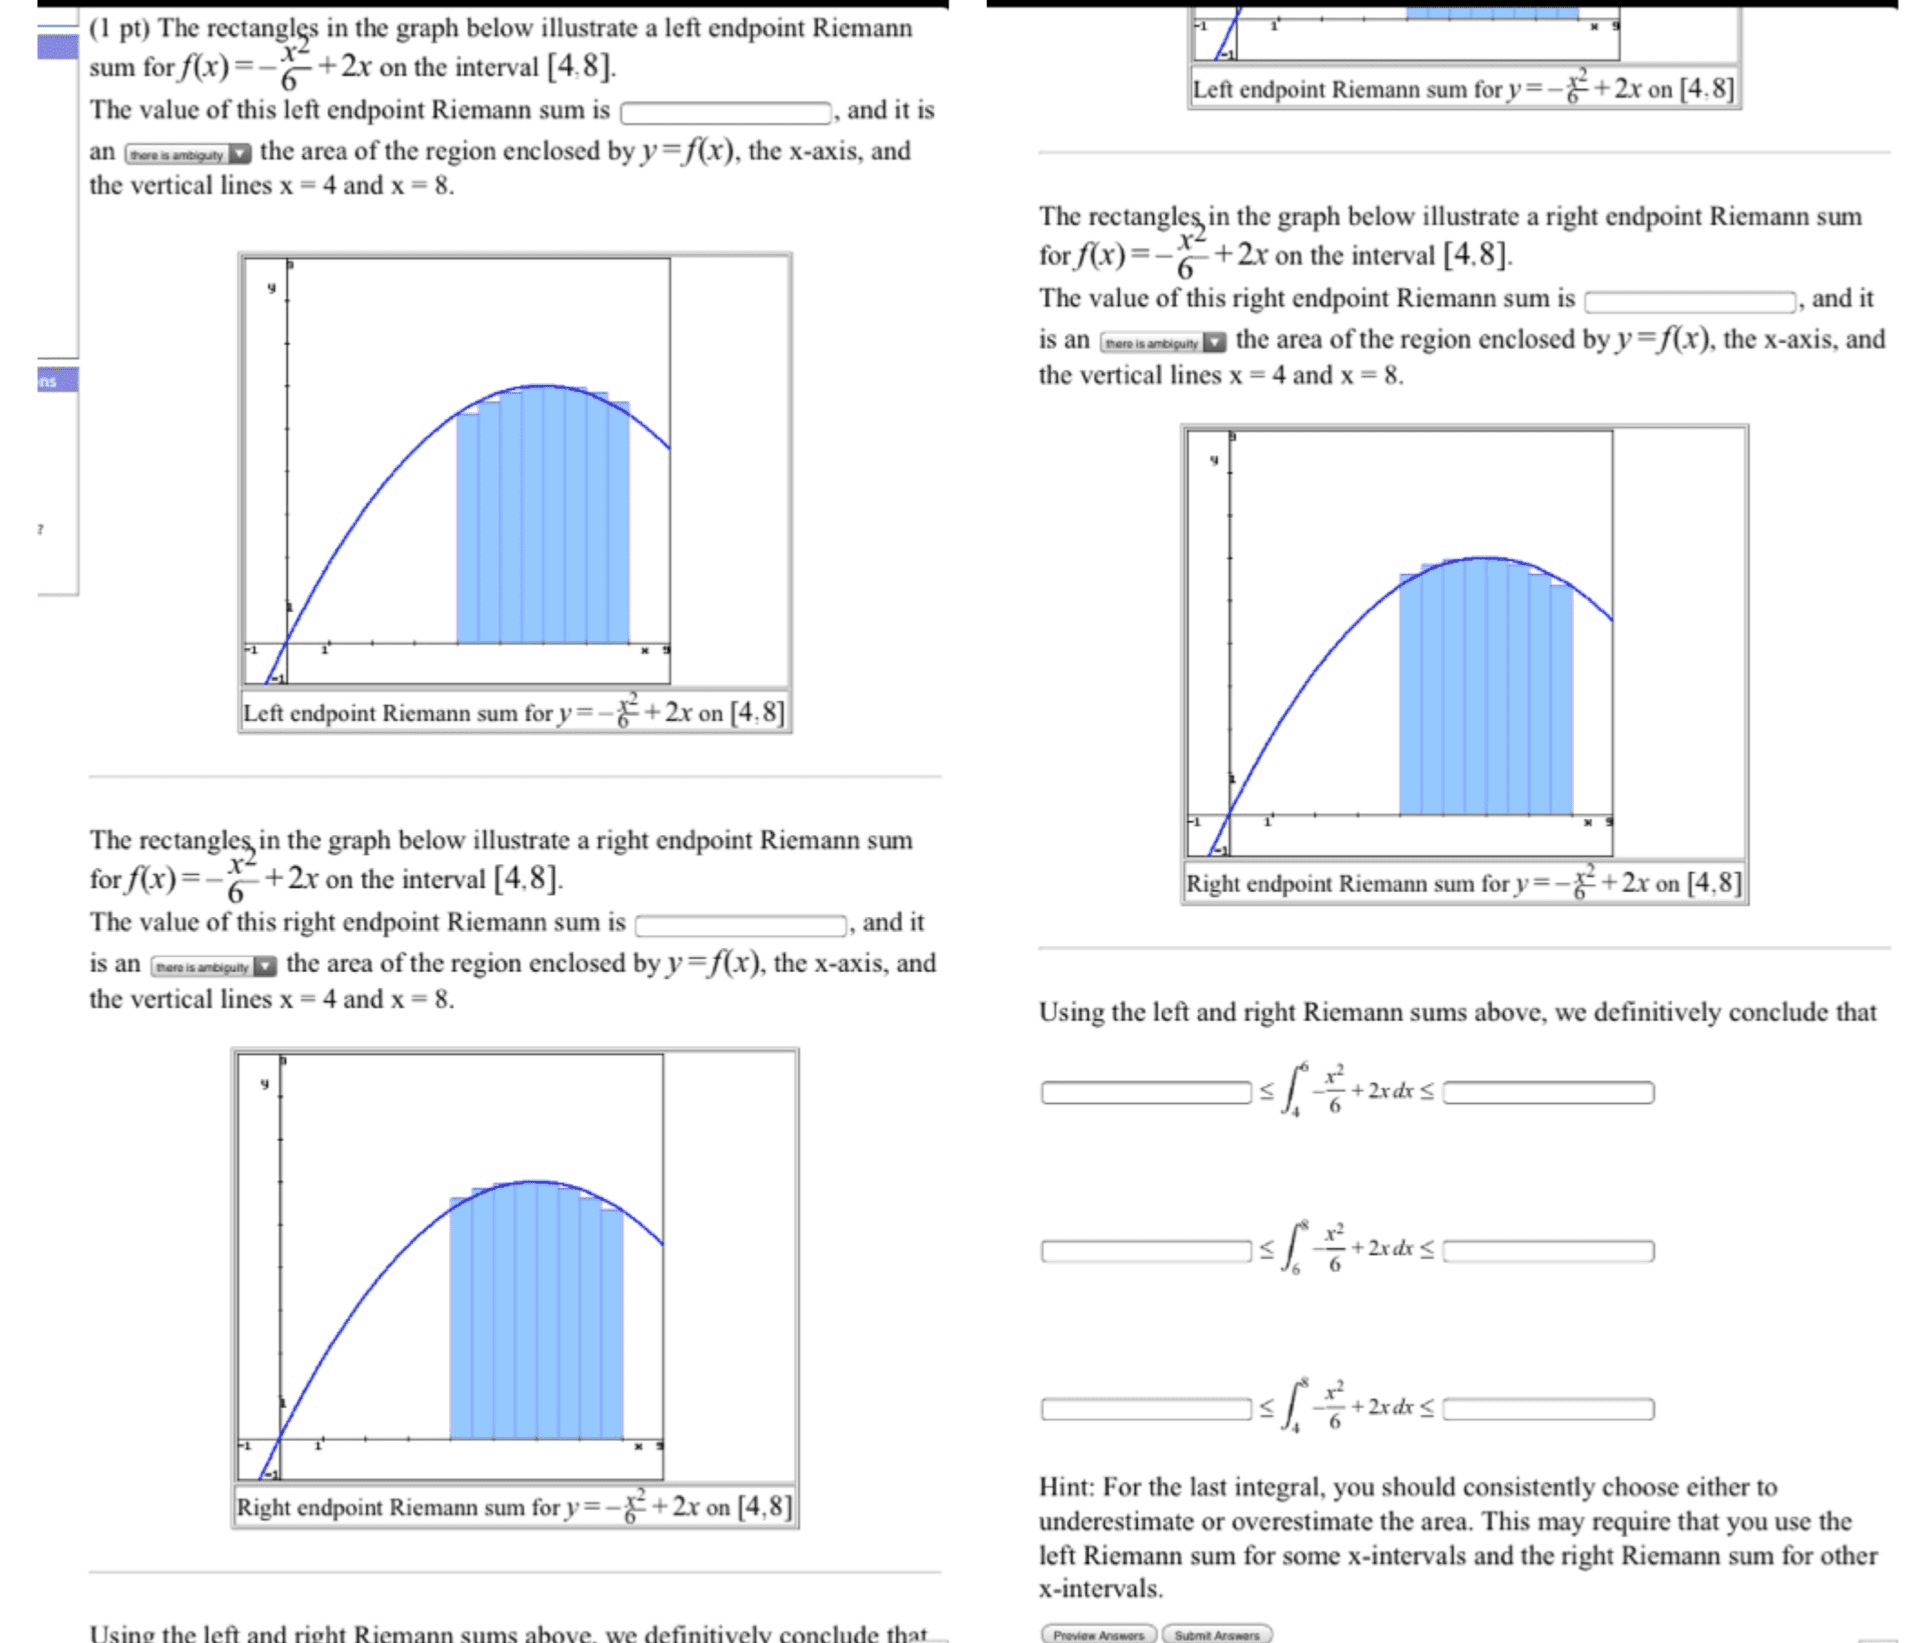
The rectangles in the graph below illustrate a left endpoint Riemann sum for f(x) = - x2 / 6 + 2x on the interval [4 8]. The value of this left endpoint Riemann sum is and it is an the area of the region enclosed by y = f(x), the x-axis, and the vertical lines x = 4 and x = 8. The rectangles in the graph below illustrate a right endpoint Riemann sum for f(x) = - x2 / 6 + 2x on the interval [4.8]. The value of this right endpoint Riemann sum is and it is an the area of the region enclosed by y = f(x), the x-axis. and the vertical lines x = 4 and x = 8. The rectangles in the graph below illustrate a right endpoint Riemann sum for f(x) = - x2 / 6 + 2x on the interval [4.8], The value of this right endpoint Riemann sum is and it is an the area of the region enclosed by y = f(x), the x-axis. and the vertical lines x = 4 and x = 8. Using the left and right Riemann sums above, we definitively conclude that Hint: For the last integral, you should consistently choose cither to underestimate or overestimate the area. This may require that you use the left Riemann sum for some x-intervals and the right Riemann sum for other x-intervals.