2
answers
1
watching
373
views

8 Mar 2021
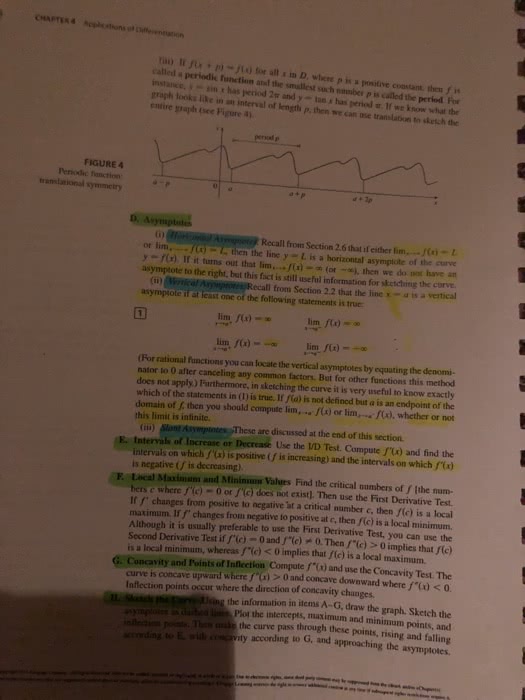
The following experimental values of x and y have been obtained
x
1.1
1.7
2.4
3.0
3.7
4.5
5.1
5.8
y
0.3
0.6
1.1
1.7
2.3
3.0
3.8
4.6
We have to draw the graph
The following experimental values of x and y have been obtained
| x | 1.1 | 1.7 | 2.4 | 3.0 | 3.7 | 4.5 | 5.1 | 5.8 |
| y | 0.3 | 0.6 | 1.1 | 1.7 | 2.3 | 3.0 | 3.8 | 4.6 |
We have to draw the graph

30 Jan 2024

Vikash KarnLv9
8 Mar 2021
Already have an account? Log in