Suppose that the U.S. and Brazil produce only two goods --- computer and coffee. The table below gives its production possibilities.
Computer Opp Cost Coffee Opp Cost
U.S.: 12 4
Brazil: 5 10
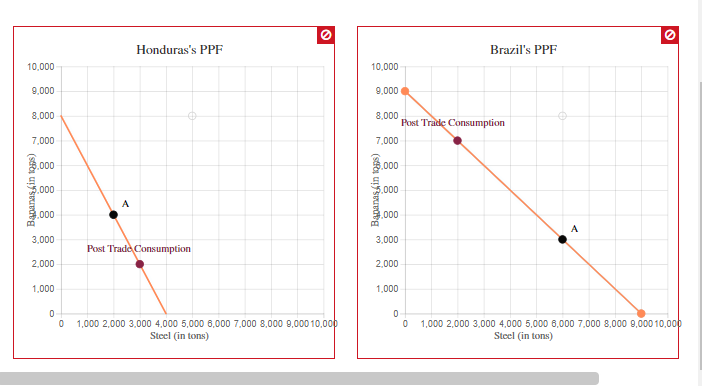
1. Draw the graphs of the production frontier for each country. Make sure that you level the diagram properly and indicate the name of the country under the graph.
2. What are the opportunity costs of producing each good in the two countries? List them in the table.
3. On which good each country has a comparative advantage?
4. Which country exports computers? Coffee?
5. What is the range of TOT in which only Brazil gains from trade?
6. What is the range of TOT in which only the U.S. gains from trade?
7. What is the range of TOT in which both countries gain from trade?

