Ch. 10
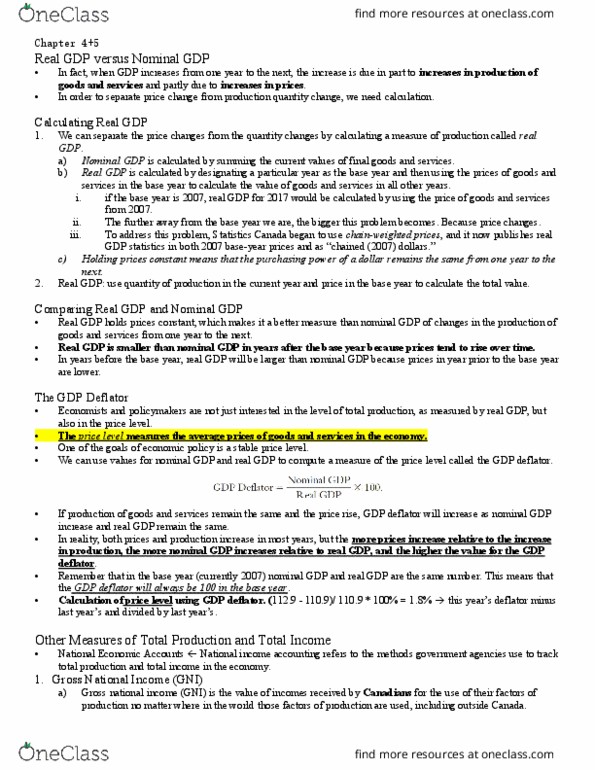
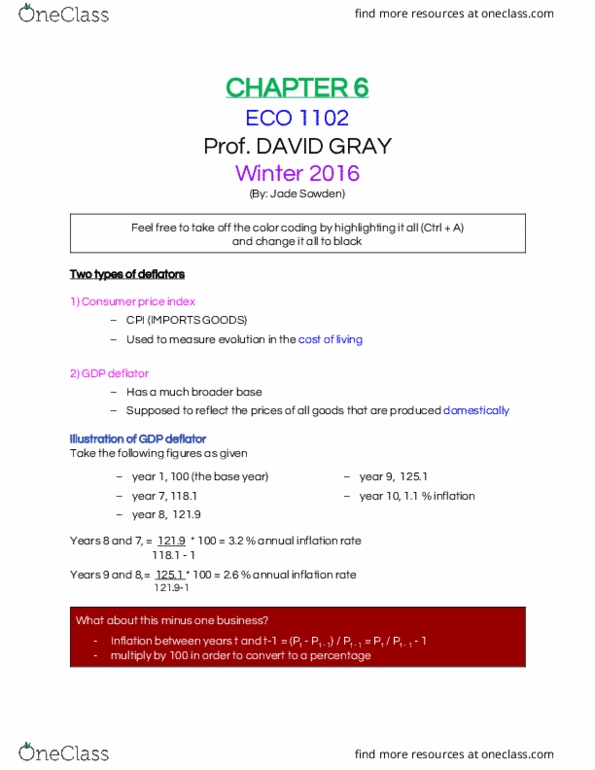
STEP: 2 of 2 The following table shows some data for an economy that produces only two goods: milk and honey. Year Milk Honey Price Quantity Price Quantity (Dollars) (Quarts) (Dollars) (Quarts) 2013 1 100 2 50 2014 1 200 2 100 2015 2 200 4 100
The following table shows nominal GDP, real GDP, and the GDP deflator for each year listed. Year Nominal GDP Real GDP GDP Deflator (Dollars) (Dollars) 2013 200 200 100 2014 400 400 100 2015 800 400 200
Compute the percentage change in nominal GDP, real GDP, and the GDP deflator in 2014 and 2015 from the preceding year. Year Percentage Change In... Nominal GDP Real GDP GDP Deflator 2014 2015
From 2013 to 2014, did not change; and from 2014 to 2015, did not change. True or False: Economic well-being rose more in 2014 than in 2015. True False step 2
Ch. 10
| Year | Milk | Honey | ||
|---|---|---|---|---|
| Price | Quantity | Price | Quantity | |
| (Dollars) | (Quarts) | (Dollars) | (Quarts) | |
| 2013 | 1 | 100 | 2 | 50 |
| 2014 | 1 | 200 | 2 | 100 |
| 2015 | 2 | 200 | 4 | 100 |
| Year | Nominal GDP | Real GDP | GDP Deflator |
|---|---|---|---|
| (Dollars) | (Dollars) | ||
| 2013 | 200 | 200 | 100 |
| 2014 | 400 | 400 | 100 |
| 2015 | 800 | 400 | 200 |
| Year | Percentage Change In... | ||
|---|---|---|---|
| Nominal GDP | Real GDP | GDP Deflator | |
| 2014 | |||
| 2015 | |||
step 2

Related textbook solutions


Related questions
Question 6: GDP
This question relates to Course Learning Objective 2 and is worth 10 points.
The table below demonstrates the U.S. Nominal GDP and Price Level, from 2006-2015.
|
Year |
Nominal GDP (billions of dollars) |
Price Level (GDP deflator) |
|---|---|---|
|
2006 |
13,855.9 |
95 |
|
2007 |
14,477.6 |
97 |
|
2008 |
14,718.6 |
99 |
|
2009 |
14,418.7 |
100 |
|
2010 |
14,964.4 |
101 |
|
2011 |
15,517.9 |
103 |
|
2012 |
16,155.3 |
105 |
|
2013 |
16,663.2 |
107 |
|
2014 |
17,348.1 |
109 |
|
2015 |
17,937.8 |
110 |
Use the information in the table to calculate the real 2015 gross domestic product in 2009 dollars. Explain how the calculation is performed and the reasoning behind it.

Consider a simple economy that only produces two goods; apples and oranges. The following table shows prices and quantities over a 3 year period.
|
Price of |
Quantity of |
Price of |
Quantity of |
|
|
YEAR |
Apples |
Apples |
Oranges |
Oranges |
|
2012 |
2 |
20 |
1 |
10 |
|
2013 |
3 |
24 |
2 |
12 |
|
2014 |
4 |
30 |
3 |
20 |
Use the information from the previous table to fill out the following table:
|
Real GDP |
GDP |
||
|
YEAR |
Nominal GDP ($) |
(The base year 2012)($) |
Deflator |
|
2012 |
|||
|
2013 |
|||
|
2014 |
Choose one from each:
From 2013 to 2014, nominal GDP (increased or decreased) and real GDP (increased or decreased).
The inflation rate in 2014 was (10%, 40.6%, 29.4%, -28.9%, or -9.1%).
Why is real GDP a more accurate measure of an economyâs production than nominal GDP?

Consider an economy that produces only chocolate bars. In year 1, the quantity produced is 3 bars and the price is $4. In year 2, the quantity produced is 4 bars and the price is $5. In year 3, the quantity produced is 5 bars and the price is $6.
Using year 1 as the base year, compute nominal GDP, real GDP, and the GDP deflator for each year.
| Year | Nominal GDP | Real GDP | GDP Deflator |
|---|---|---|---|
| (Dollars) | (Dollars) | ||
| Year 1 | |||
| Year 2 | |||
| Year 3 |
The percentage growth rate of real GDP from year 2 to year 3 is. ______%
The inflation rate as measured by the GDP deflator from year 2 to year 3 is. ______%