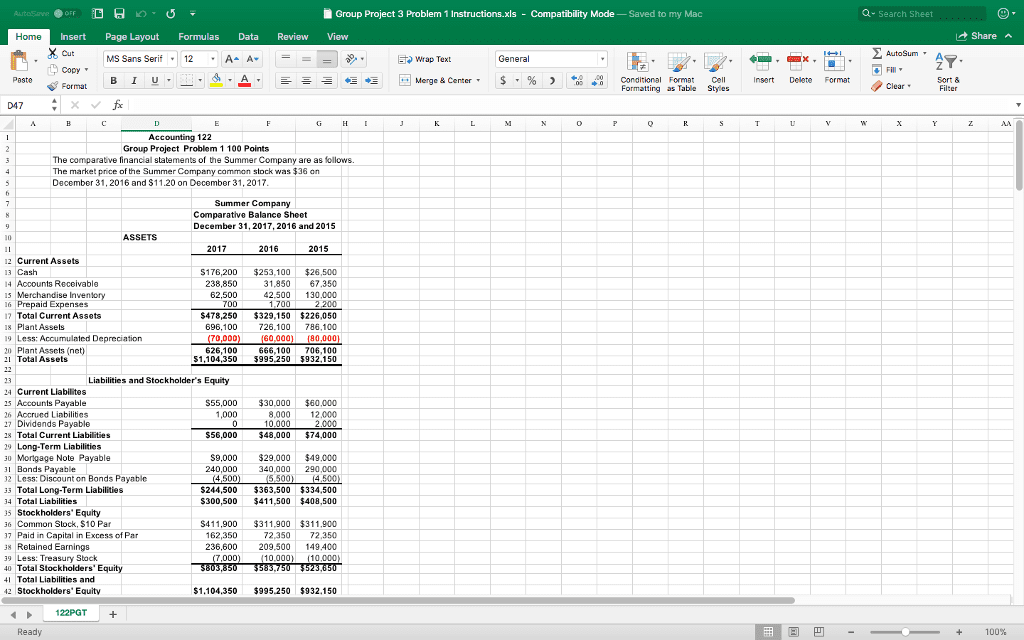
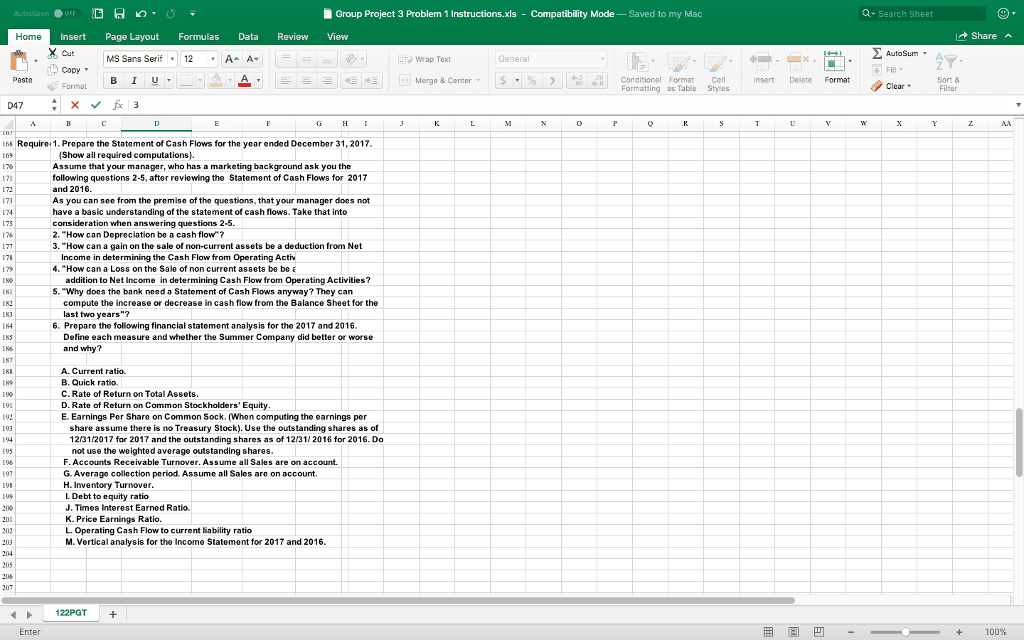
AutoSave OFF D A D - U - Q- Search Sheet Home Page Layout Formulas Data Review + Share a 12 I Group Project 3 Problem 1 Instructions.xls - Compatibility Mode â Saved to my Mac View = 5 Wrap Text General = = = A Merge & Center $ % 2 % 2 % Conditional Format Formatting as Table = = Insert X Cut O copy Format - X V > AutoSum 'AY: MS Sans Serif B I U - - A+ A- 4 - A - Paste - = = Cell Styles Insert Delete Format / 0 Clear Clear" Sort & Filter D47 fix Accounting 122 Group Project Problem 1 100 Points The comparative financial statements of the Summer Company are as follows. The market price of the Summer Company common stock was $36 on December 31, 2016 and S11.20 on December 31, 2017. Summer Company Comparative Balance Sheet December 31, 2017, 2016 and 2015 ASSETS 2017 2016 2015 12 Current Assets 13 Cash 14 Accounts Receivable 15 Merchandise Inventory 16 Prepaid Expenses 17 Total Current Assets 18 Plant Assets 19 Less: Accumulated Depreciation 20 Plant Assets (net) 11 Total Assets S176,200 238,850 62.500 700 $478,250 696,100 (70,000) 626,100 $1,104,350 $253,100 $26.500 31,850 67,350 42.500 130.000 1.700 2 200 $329,150 $226,050 726,100 786,100 (60,000) (80,000) 666,100 706, 100 $995 250 5932.150 $30,000 8,000 10.000 $48,000 $60,000 12.000 2.000 $74,000 Liabilities and Stockholder's Equity 24 Current Liabilites 15 Accounts Payable S55,000 26 Accrued Linbilities 1,000 27 Dividends Payable 28 Total Current Liabilities $56,000 29 Long-Term Liabilities 30 Mortgage Note Payable S9,000 31 Bonds Payable 240,000 12 Less: Discount on Bonds Payable (4,500) 33 Total Long-Term Liabilities $244,500 34 Total Liabilities $300,500 35 Stockholders' Equity 36 Common Stock, $10 Par S411,900 37 Paid in Capital in Excess of Par 162,350 38 Retained Earnings 236,600 39 Less: Treasury Stock (7,000) 40 Total Stockholders' Equity S803,850 41 Total Liabilities and 42 Stockholders' Equity $1,104,350 $29,000 $49.000 340,000 290,000 (5,500) (4.500) $363,500 $334,500 $411,500 $408,500 $311,900 $311,900 72,350 72,350 209,500 149.400 10,000) (10,000) 583,750 $523,850 $995.250 $932,150 122PGT + Ready A D 0 - - - + 100%
Show transcribed image textAutoSave OFF D A D - U - Q- Search Sheet Home Page Layout Formulas Data Review + Share a 12 I Group Project 3 Problem 1 Instructions.xls - Compatibility Mode â Saved to my Mac View = 5 Wrap Text General = = = A Merge & Center $ % 2 % 2 % Conditional Format Formatting as Table = = Insert X Cut O copy Format - X V > AutoSum 'AY: MS Sans Serif B I U - - A+ A- 4 - A - Paste - = = Cell Styles Insert Delete Format / 0 Clear Clear" Sort & Filter D47 fix Accounting 122 Group Project Problem 1 100 Points The comparative financial statements of the Summer Company are as follows. The market price of the Summer Company common stock was $36 on December 31, 2016 and S11.20 on December 31, 2017. Summer Company Comparative Balance Sheet December 31, 2017, 2016 and 2015 ASSETS 2017 2016 2015 12 Current Assets 13 Cash 14 Accounts Receivable 15 Merchandise Inventory 16 Prepaid Expenses 17 Total Current Assets 18 Plant Assets 19 Less: Accumulated Depreciation 20 Plant Assets (net) 11 Total Assets S176,200 238,850 62.500 700 $478,250 696,100 (70,000) 626,100 $1,104,350 $253,100 $26.500 31,850 67,350 42.500 130.000 1.700 2 200 $329,150 $226,050 726,100 786,100 (60,000) (80,000) 666,100 706, 100 $995 250 5932.150 $30,000 8,000 10.000 $48,000 $60,000 12.000 2.000 $74,000 Liabilities and Stockholder's Equity 24 Current Liabilites 15 Accounts Payable S55,000 26 Accrued Linbilities 1,000 27 Dividends Payable 28 Total Current Liabilities $56,000 29 Long-Term Liabilities 30 Mortgage Note Payable S9,000 31 Bonds Payable 240,000 12 Less: Discount on Bonds Payable (4,500) 33 Total Long-Term Liabilities $244,500 34 Total Liabilities $300,500 35 Stockholders' Equity 36 Common Stock, $10 Par S411,900 37 Paid in Capital in Excess of Par 162,350 38 Retained Earnings 236,600 39 Less: Treasury Stock (7,000) 40 Total Stockholders' Equity S803,850 41 Total Liabilities and 42 Stockholders' Equity $1,104,350 $29,000 $49.000 340,000 290,000 (5,500) (4.500) $363,500 $334,500 $411,500 $408,500 $311,900 $311,900 72,350 72,350 209,500 149.400 10,000) (10,000) 583,750 $523,850 $995.250 $932,150 122PGT + Ready A D 0 - - - + 100%