4
answers
2
watching
255
views

4 Jan 2023
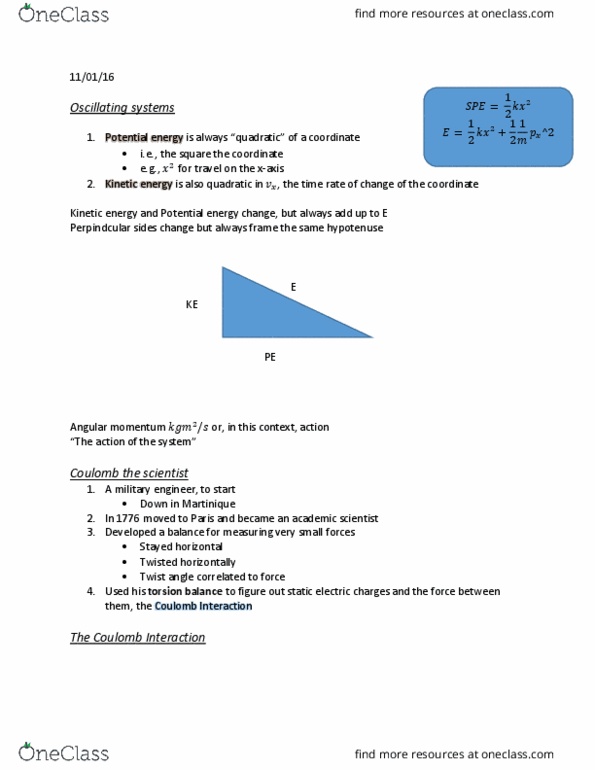
It’s about kinetic energy and potential energy
Visualizing Physical Quantities That Affect Kinetic and Potential Energy
Use with textbook pages 210-211.
1. Making Connections with Visuals
Look at the illustration on pages 210 and 211 showing the transformation of kinetic energy and potential energy. Read the introductory paragraph and the individual captions for each image. Apply your understanding to describe the energy transformations in each of the following scenarios. Provide a similar caption for each of the labelled stages of the diagrams.
A: _______________________________________________________________________________________________________________________________
B: _______________________________________________________________________________________________________________________________
C: _______________________________________________________________________________________________________________________________
D: _______________________________________________________________________________________________________________________________
Modelling Conservation of Energy
Use with textbook poges 209-214.
A 1.0 kg ball is released from rest at point A on a frictionless track, as shown on the diagram below.
1. Shade the bar graphs below each labelled point to indicate the kinetic energy, potential energy, and total energy of the ball. Each square in the bar graphs represents 10 J of energy.
 2. Explain what is happening to the energy in the system as the ball moves between each point.
a) From A to B
b) From B to C
c) From C to D
3. How would the graphs differ if there was friction between the ball and track?
2. Explain what is happening to the energy in the system as the ball moves between each point.
a) From A to B
b) From B to C
c) From C to D
3. How would the graphs differ if there was friction between the ball and track?
It’s about kinetic energy and potential energy
Visualizing Physical Quantities That Affect Kinetic and Potential Energy
Use with textbook pages 210-211.
1. Making Connections with Visuals
Look at the illustration on pages 210 and 211 showing the transformation of kinetic energy and potential energy. Read the introductory paragraph and the individual captions for each image. Apply your understanding to describe the energy transformations in each of the following scenarios. Provide a similar caption for each of the labelled stages of the diagrams.
A: _______________________________________________________________________________________________________________________________
B: _______________________________________________________________________________________________________________________________
C: _______________________________________________________________________________________________________________________________
D: _______________________________________________________________________________________________________________________________
Modelling Conservation of Energy
Use with textbook poges 209-214.
A 1.0 kg ball is released from rest at point A on a frictionless track, as shown on the diagram below.
1. Shade the bar graphs below each labelled point to indicate the kinetic energy, potential energy, and total energy of the ball. Each square in the bar graphs represents 10 J of energy.
2. Explain what is happening to the energy in the system as the ball moves between each point.
a) From A to B
b) From B to C
c) From C to D
3. How would the graphs differ if there was friction between the ball and track?

Read by 4 people

skaramjeet12Lv6
7 Jan 2023
Read by 4 people

6 Jan 2023
Already have an account? Log in
Read by 6 people

Read by 7 people

4 Jan 2023
Already have an account? Log in