Statistical Sciences 1024A/B Study Guide - Midterm Guide: Interquartile Range, Probability Distribution, Random Variable

7 Dec 2015
School
Department
Professor

Document Summary
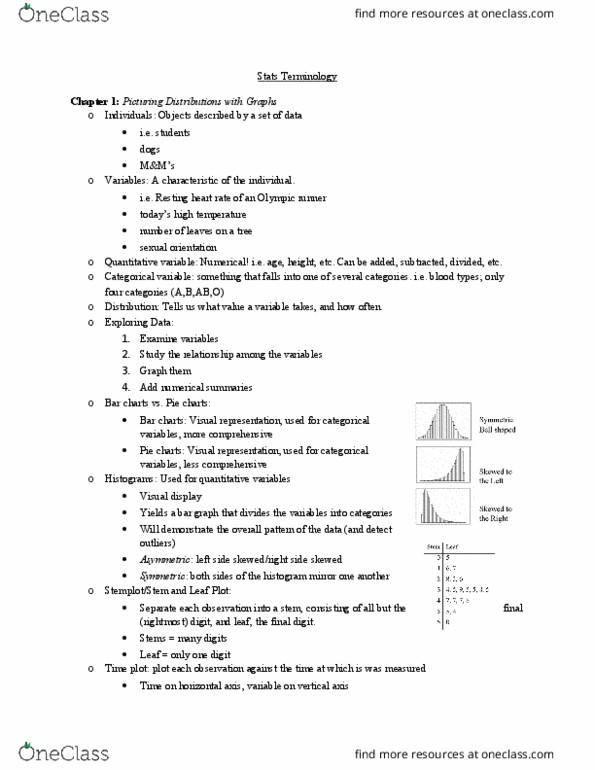
Pie charts: divide value by total to get proportion, multiply by deviation: only useful for emphasizing part"s relation to whole. Bar graphs and pie charts are categorical, not quantitative. Histogram: bar graph relating quantity to a measurement unit x; Time plot: line graph where x=time: use cycles - regular up/down, use trends (general direction) Cumulative frequency graph: line graph of running total of frequencies from lowest value up. Relative- frequency (table/diagram): compares to total as decimal. Index relates variable(s) to base level e. g. value at particular time. Measures of central tendency values, n is the # of data values. Mean of sample, x = x / n or even 1/n( x) where is the sum of the data. Mean of population, = x / n. Sum of (weighting factors * data values) / weighting factors. Fm / f where m is the midpoint and f is the frequency of that interval.