ISA 205 Study Guide - Midterm Guide: Confidence Interval, Histogram, Total Variation

28 Jun 2018
School
Department
Course
Professor

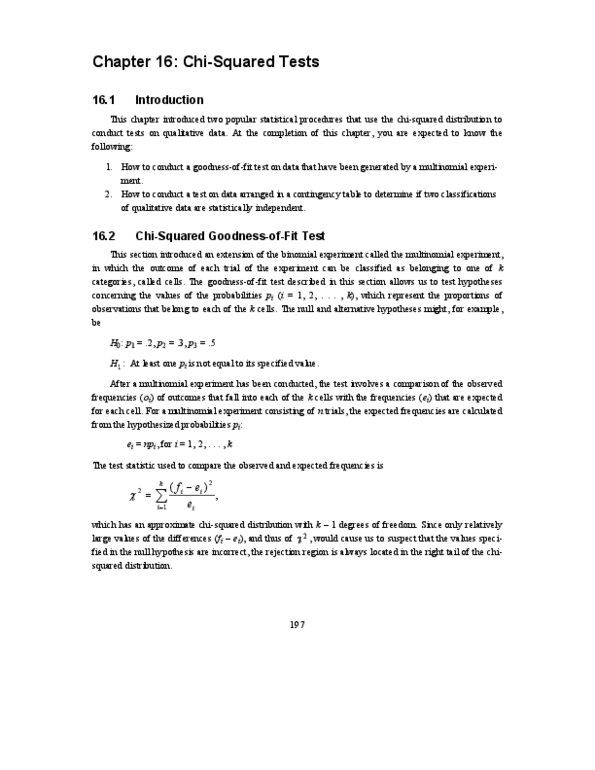
Goodness of Fit test for multinomial probabilities:
H0: multinomial probabilities are p1, p2, … , pk reject H0 if: c2 > ca2 or p-value < a
Ha: at least one of the probabilities differs from p1, p2, … , pk c2 and the p-value are based on k-1 DOF
test statistic:
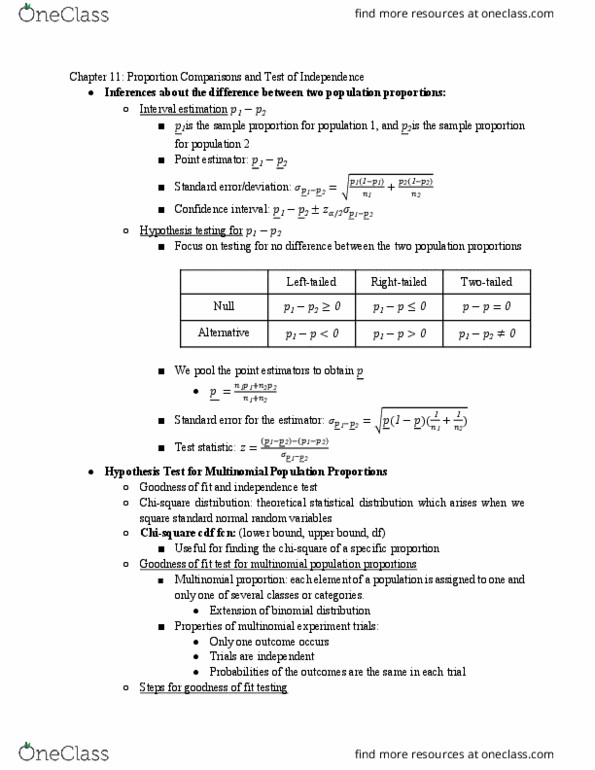
Chi-square test for independence: each of n randomly selected items is classified on 2 dimensions into a contingency
table with r rows and c columns; let:
◦fij = observed cell frequency for ith row and jth column
◦ri = ith row total AND cj = jth column total
Expected cell frequency for ith row and jth column under independence:
H0 : the 2 classifications are statistically independent; Ha: the two classifications are statistically dependent
test statistic:
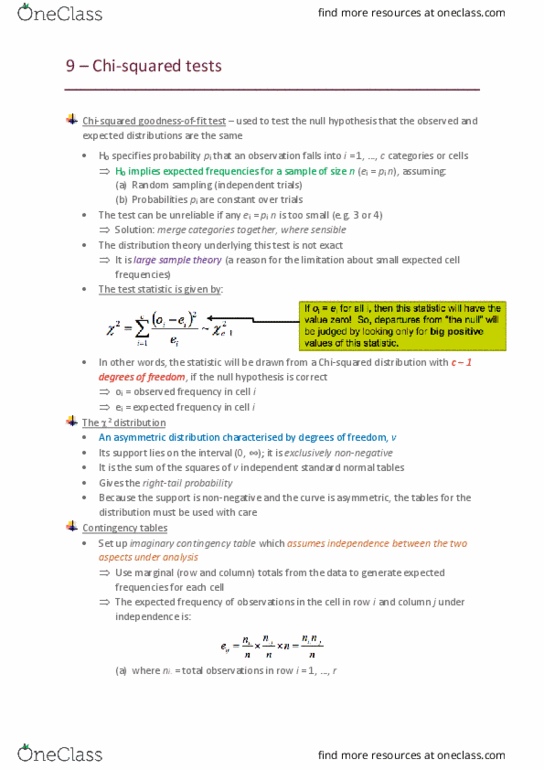
dependent (response): variable we wish to understand or predict; independent (predictor): variable we use to
understand or predict the dependent; regression analysis: used to describe, predict, control dep var based on ind var
β0 and β1 regression parameters , β0 y intercept, β1 slope use sample data to estimate, don’t know true values
estimation/prediction equation: ŷ = b0 + b1x least squares point estimate of y-intercept b0
n
x
xxxSS
n
yx
yxyyxxSS
SS
SS
b
i
iixx
ii
iiiixy
xx
xy
2
2
2
1
)(
)()(
Model Assumptions and the Standard Error
1. Mean of Zero: At any given value of x, the population of potential error term values has a mean equal to zero
2. Constant Variance Assumption: At any given value of x, the population of potential error term values has a variance
that does not depend on the value of x
3. Normality Assumption: At any given value of x, the population of potential error term values has a normal distribution
4. Independence Assumption: Any one value of the error term ε is statistically independent of any other value of ε
Sum of squared errors (SSE) Mean square error (MSE) Standard Error .
point estimate of residual variance σ2point estimate of resid stnd. dev. σ
n
x
x
n
y
yxbyb
ii
10
22
)
ˆ
(
iii
yyeSSE
2n-
SSE
MSEs
2
2
n-
SSE
MSEs
find more resources at oneclass.com
find more resources at oneclass.com
Document Summary
H0: multinomial probabilities are p1, p2, , pk. Ha: at least one of the probabilities differs from p1, p2, , pk test statistic: reject h0 if: c2 > ca c2 and the p-value are based on k-1 dof. Expected cell frequency for ith row and jth column under independence: 0 and 1 regression parameters , 0 y intercept, 1 slope use sample data to estimate, don"t know true values least squares point estimate of y-intercept b0 estimation/prediction equation: y = b0 + b1x b. Ss xy x i yx i y yx i i x i n. 1 y y i n x x i n b. Independence assumption: any one value of the error term is statistically independent of any other value of . Sum of squared errors (sse) point estimate of residual variance 2. Mean square error (mse) point estimate of resid stnd. dev.