STAT 1000Q Study Guide - Midterm Guide: Level Of Measurement, Box Plot, Quartile

29 Mar 2017
School
Department
Course
Professor


73
STAT 1000Q Full Course Notes
Verified Note
73 documents
Document Summary
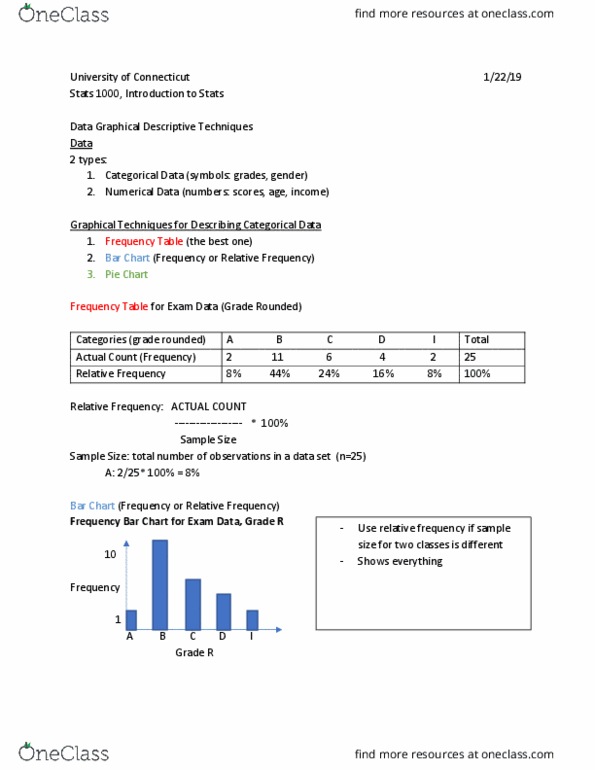
Two types of data: categorical data (symbols: grades, gender, numerical data (numbers: scores, age, income) Graphical descriptive techniques for categorical data: frequency table (the best way to describe categorical data, bar chart (two different bar charts; frequency or relative frequency, pie chart. Relative frequency = actual count x 100% sample size. Graphical descriptive techniques for numerical data: histogram (two different histogram; frequency or relative frequency, stem and leaf display. Class frequency = # of observations in the class. Class relative frequency = class frequency sample size (n) Four typical shape characteristics of a histogram: symmetry, skewness (can be negatively skewed or positively skewed, number of model classes = a model class is the one with the largest number of observations, bell shaped histogram. The difference between steam and leaf display and a histogram is that with a stem and leaf display you see every observation. Central point: sample mean (x) (arithmetic average, median.