COMMERCE 1B03 Chapter Notes - Chapter 2: Opportunity Cost, Andor Technology

4 Feb 2014
School
Department
Course
Professor

Document Summary
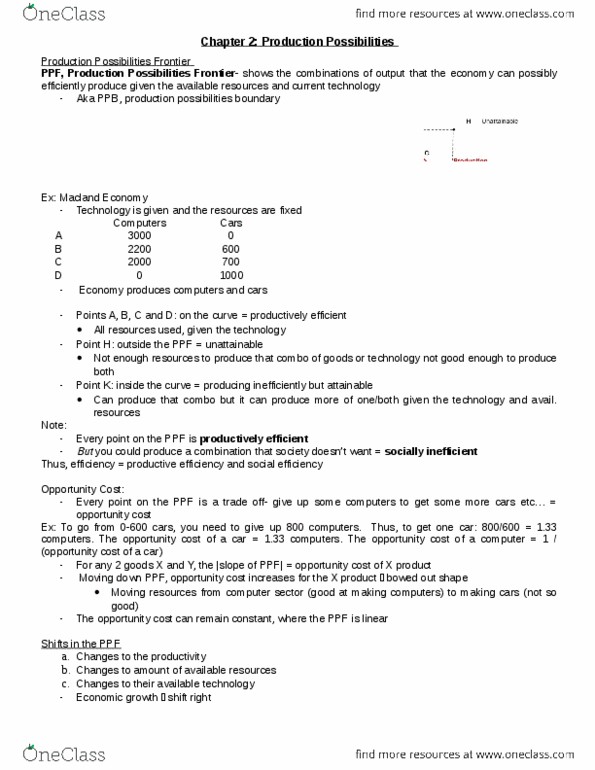
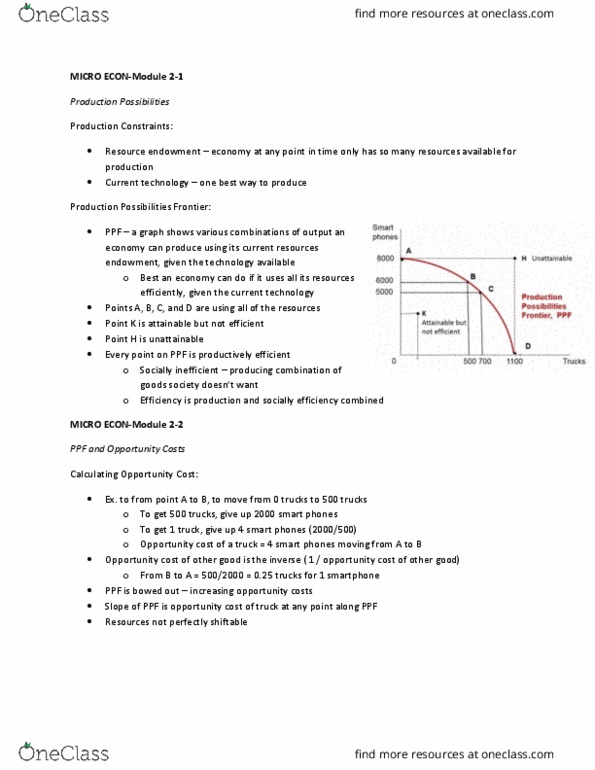
Production possibilities frontier (ppf) graph showing all possible combinations of output. Shows the best an economy can do using resources efficiently and production technology. Point a-d: factors of production and available production technology being used efficiently. Point h: unattainable because not enough resources and/or technology is not good enough. Point k: available but the company can produce more of either with available resources/technology. All of the point on the ppf line are efficient (productive efficiency) However, the wrong combination of products could be being made (socially inefficient) Ppf graphs illustrate opportunity cost (to make one thing, you have to give up the other) The slope is the opportunity cost (opportunity cost of x-axis) Opportunity cost of y-axis = 1/(opportunity cost of x-axis) Opportunity cost of computers = 1/(opportunity cost of cars) The graph is bow-shaped when the opportunity cost increases when moving down the. Opportunity cost increases because of different skill levels (company more skilled at.